

Finding your way around
Pivot has a bar across the top and a menu down the side. Every page is in the menu, and search takes you to any of them from the keyboard.
The top bar
Section titled “The top bar”

The two ends of the top bar, on demo data.
- EPOS and WFL Sales are Pivot’s two sections. EPOS is your sales and stock from each retailer. WFL Sales is what WFL has invoiced for your brand, if WFL distributes it. Click one to switch. If a section is labelled Request Trial, Not licensed or Enquire, your account doesn’t include it: contact us if you’d like it.
- The ☰ button hides the menu, and shows it again.
- What’s new lists the latest changes to Pivot. They’re also on the What’s new page here.
- The sun or moon button switches between light and dark mode. See Account and access.
- The ⋮ button opens a menu with your name at the top, then:
- Switch Brand, if you look after more than one brand. The menu and every page follow the brand you pick.
- API access and Export, if they’re switched on for your account. See Downloading data.
- Show site tour, which replays the short tour from your first sign-in.
- Logout.
The menu
Section titled “The menu”In EPOS, All Retailers comes first, with the pages that put every retailer together: Sales, Yearly Sales and Prev Period Comparison (Previous Period Comparison). Then there’s a heading for each retailer that sells your brand, with that retailer’s pages underneath.
Each retailer has only the pages its data supports. For example, only Tesco, Waitrose, Morrisons and Booths have Wastage. See Retailers for what each one has.
A page added in the last seven days has a New tag. Hover over it to see the date, and read about it in What’s new.
WFL Sales has its own menu with its own pages.
Search
Section titled “Search”Press Ctrl K (or ⌘K on a Mac) anywhere in Pivot, or click the search box at the top of the menu. Then type a page, a retailer or a metric, for example “tesco rate of sale”, “wastage” or “units”.
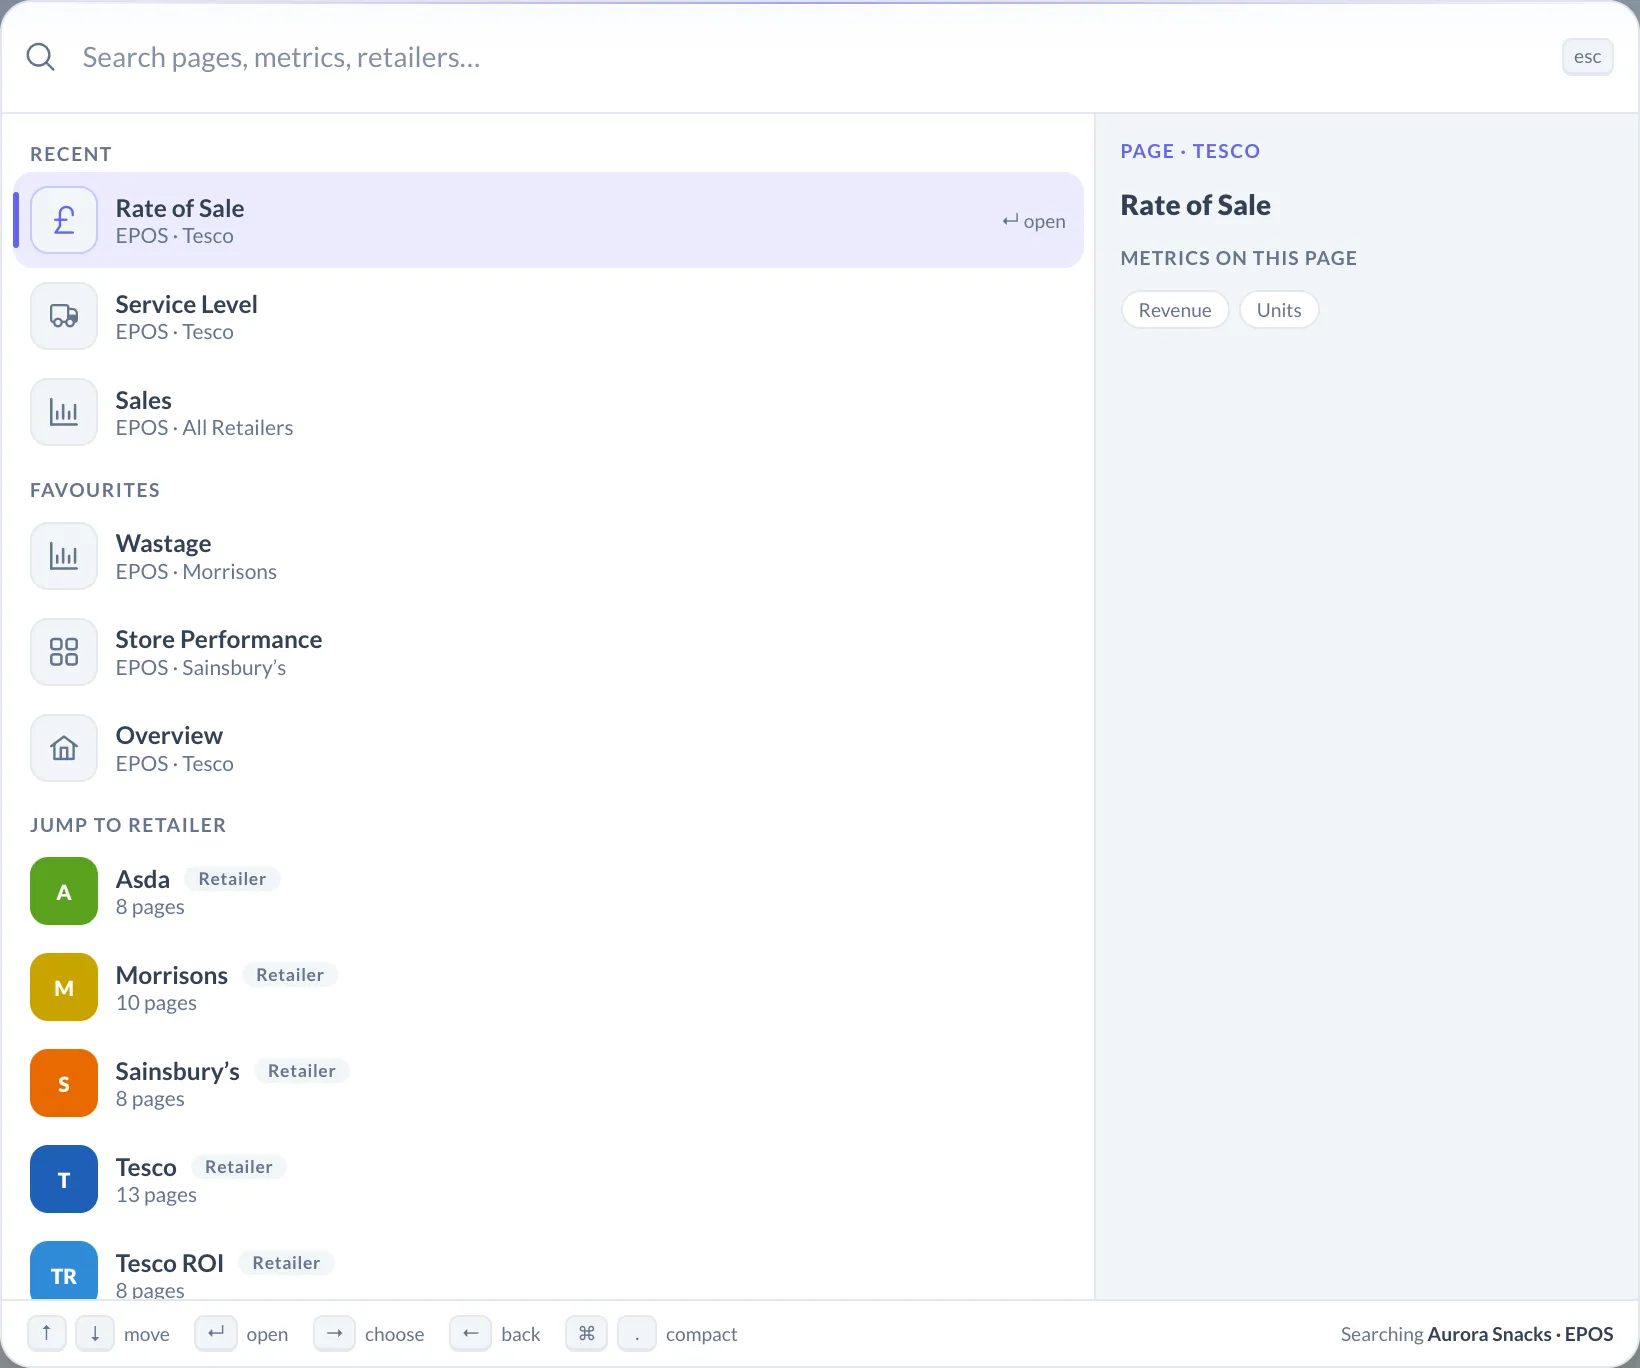
Shown on demo data.
Before you type, search lists:
- Recent: the last pages you opened from search, newest first. They’re kept in this browser only.
- Favourites: the pages you’ve starred (see Favourites).
- Jump to retailer: each retailer that sells your brand, with how many pages it has.
When you type:
- A page several retailers have, such as Rate of Sale, shows once. Enter opens it for the retailer you’re on. The right arrow lists every retailer that has it.
- A retailer: the right arrow lists its pages. Or type the page after the retailer, for example “tesco wastage”, to go straight there.
- A metric, such as units or revenue, lists the pages that show it. The right arrow picks the page, then the retailer, and the page opens with that metric selected.
- Another brand’s name, if you look after more than one, switches Pivot to that brand.
The panel on the right says what Enter will do for the highlighted result.
Search finds the same pages the menu shows, so it won’t find a page the menu has left out.
| Key | What it does |
|---|---|
| ↑ ↓ | Move up and down the list |
| Enter | Open the highlighted result |
| → or Tab | Show its choices: the retailers for a page, the pages for a retailer |
| ← or Backspace, with the box empty | Go back a step |
| Esc | Go back a step, or close search |
| Ctrl . (or ⌘. on a Mac) | Switch to a compact list without the panel on the right. Pivot remembers this in this browser. |
Favourites
Section titled “Favourites”Star the pages you use most, then switch the menu to show only those.
- At the bottom of the menu, choose Favourites.
- Choose Choose pages. Once you have favourites, it’s Edit favourites instead.
- Hover over a page in the menu and click its star. Click the star again to remove it.
- Choose Done.
All, next to Favourites, shows the whole menu again.
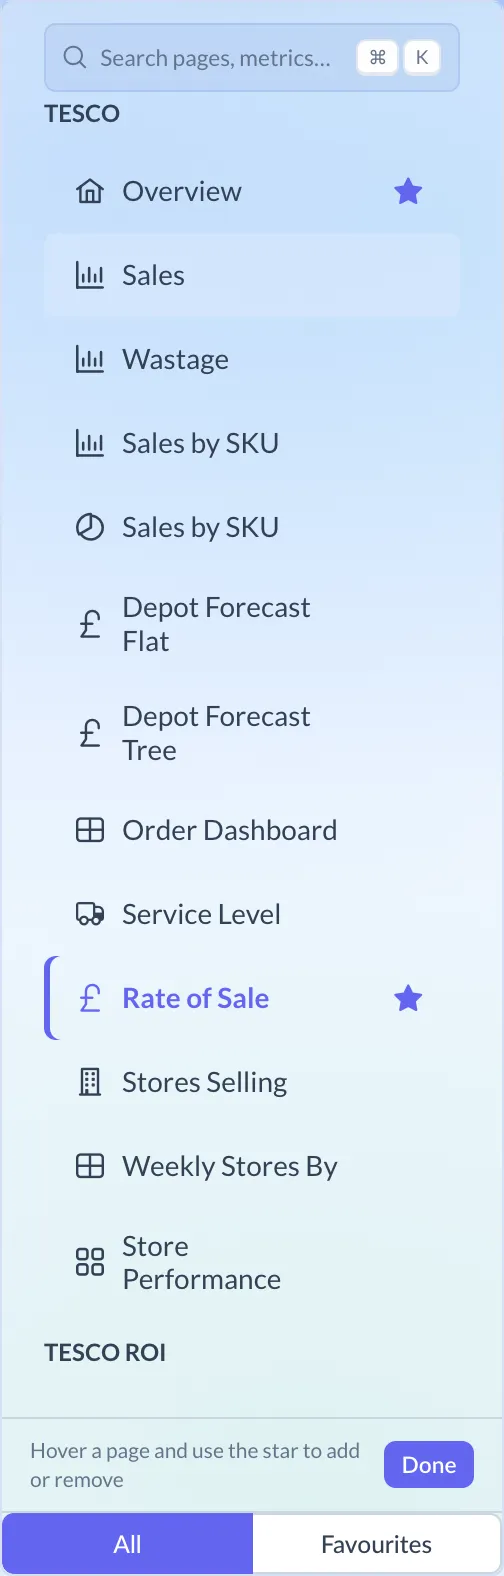
- Favourites are saved to your account, so they follow you to any computer you sign in on.
- EPOS and WFL Sales each have their own favourites.
- Your favourites also appear in search before you type.
The buttons on a chart
Section titled “The buttons on a chart”Most charts have buttons at the top right. Not every chart has all of them.
- Download saves the figures behind the chart as a CSV.
- Share makes a picture of the chart with the Pivot logo, with or without its title, legend and axes. Copy it to paste into an email or a slide, or download it as a JPG.
- Settings (the cog) opens Graph Settings, with the date range and, on some charts, the time frame, for example weekly or monthly.
- Save keeps the chart as it is for next time: the date range, the time frame, and choices made on the chart itself such as Revenue or Units and bars or lines. Saved settings are kept with your account, so they apply on any computer.
- Reset puts the chart back to how Pivot first shows it.
- Full View opens the chart across the whole screen. Close it with × at the top right.
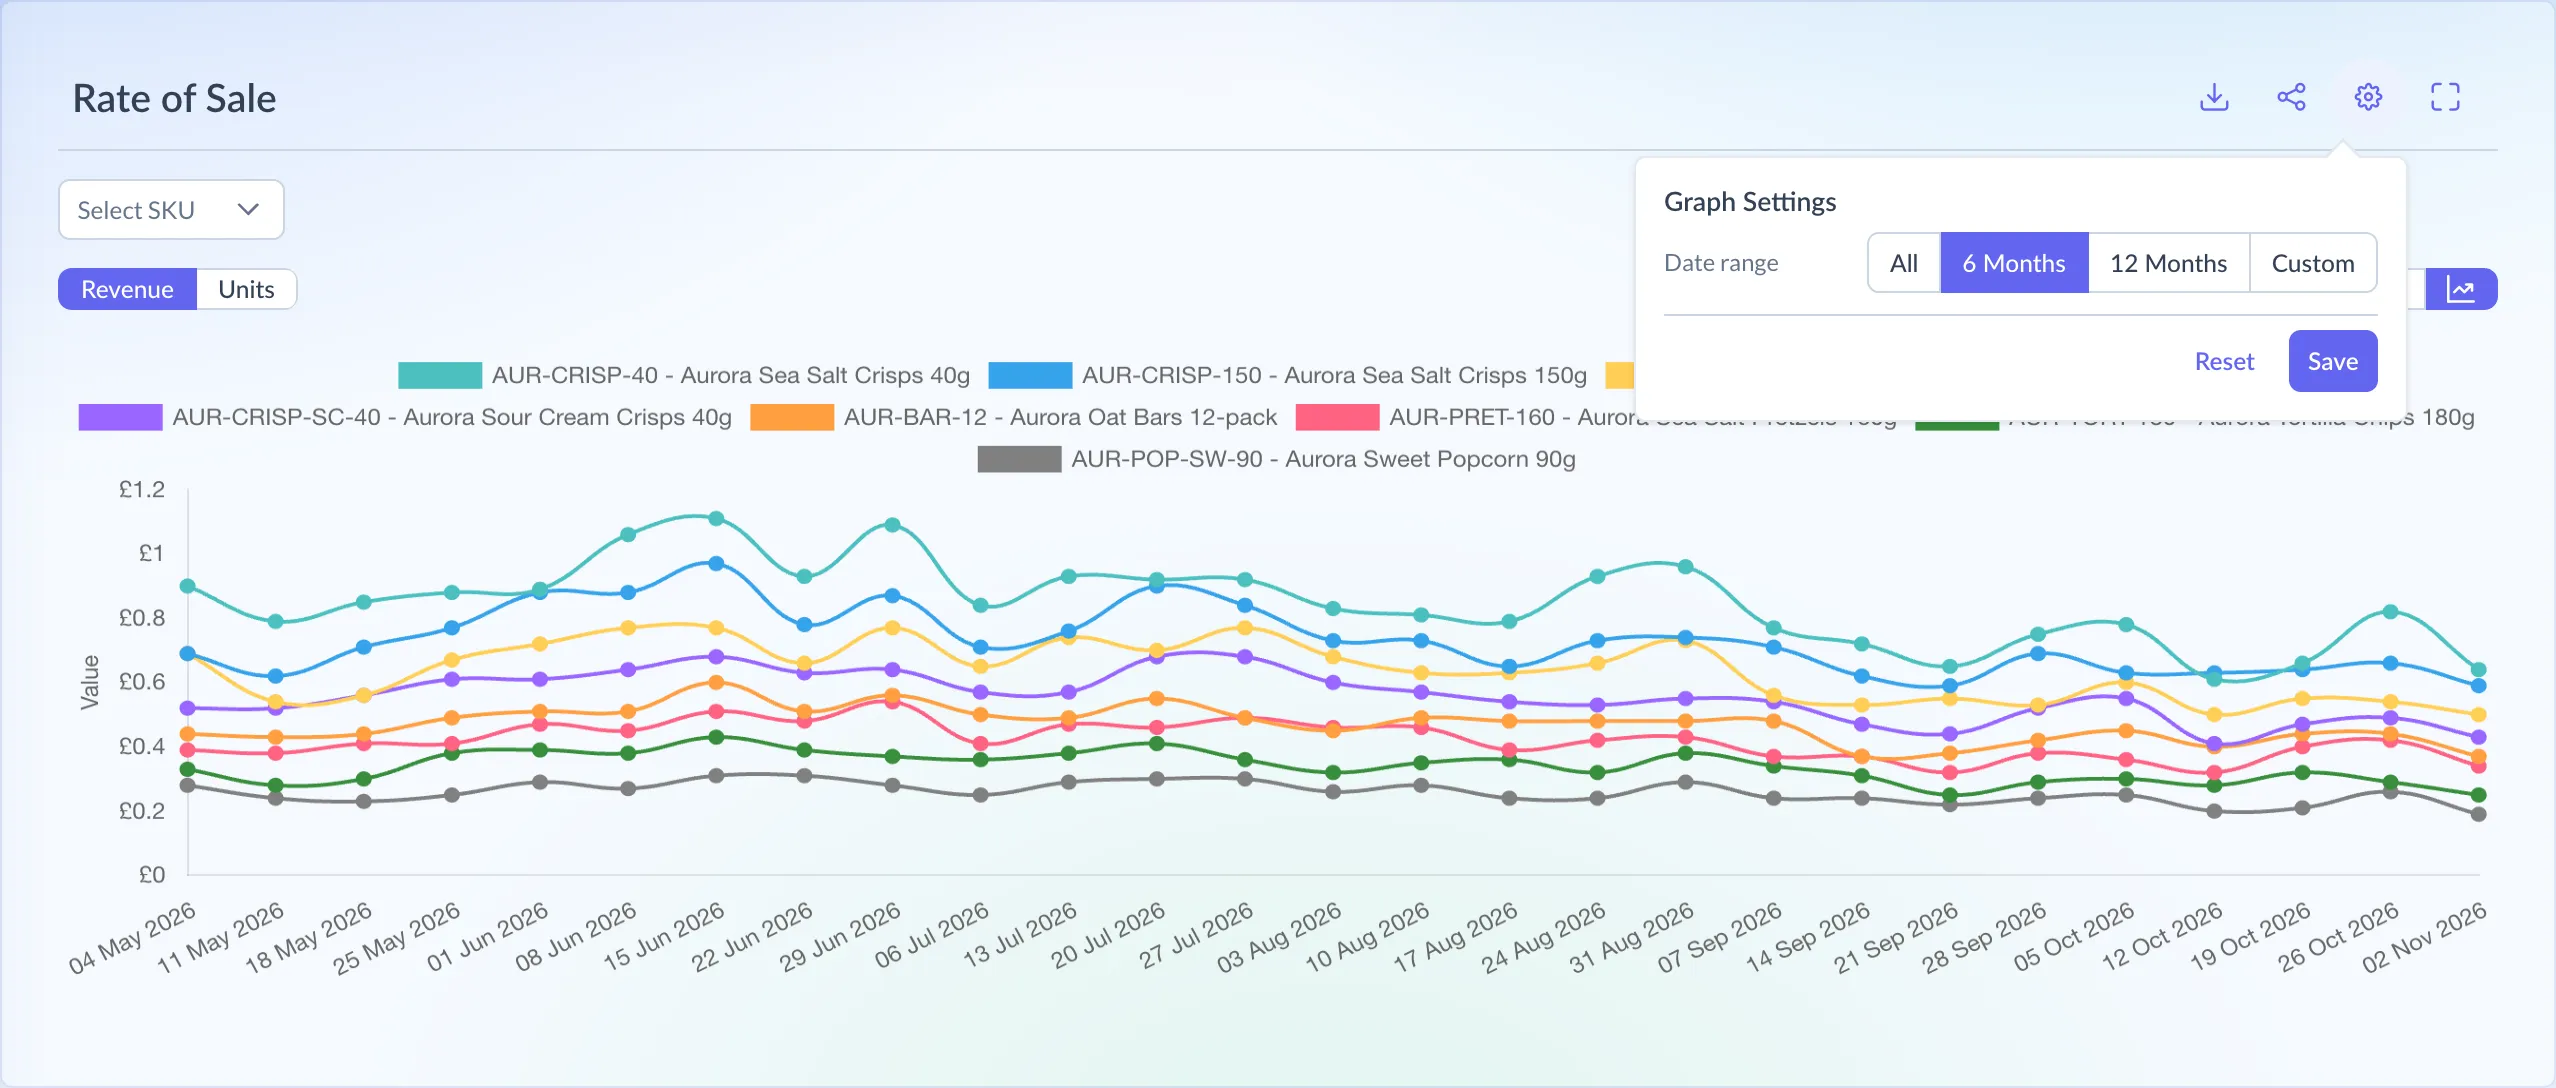
Graph Settings on Rate of Sale, on demo data.
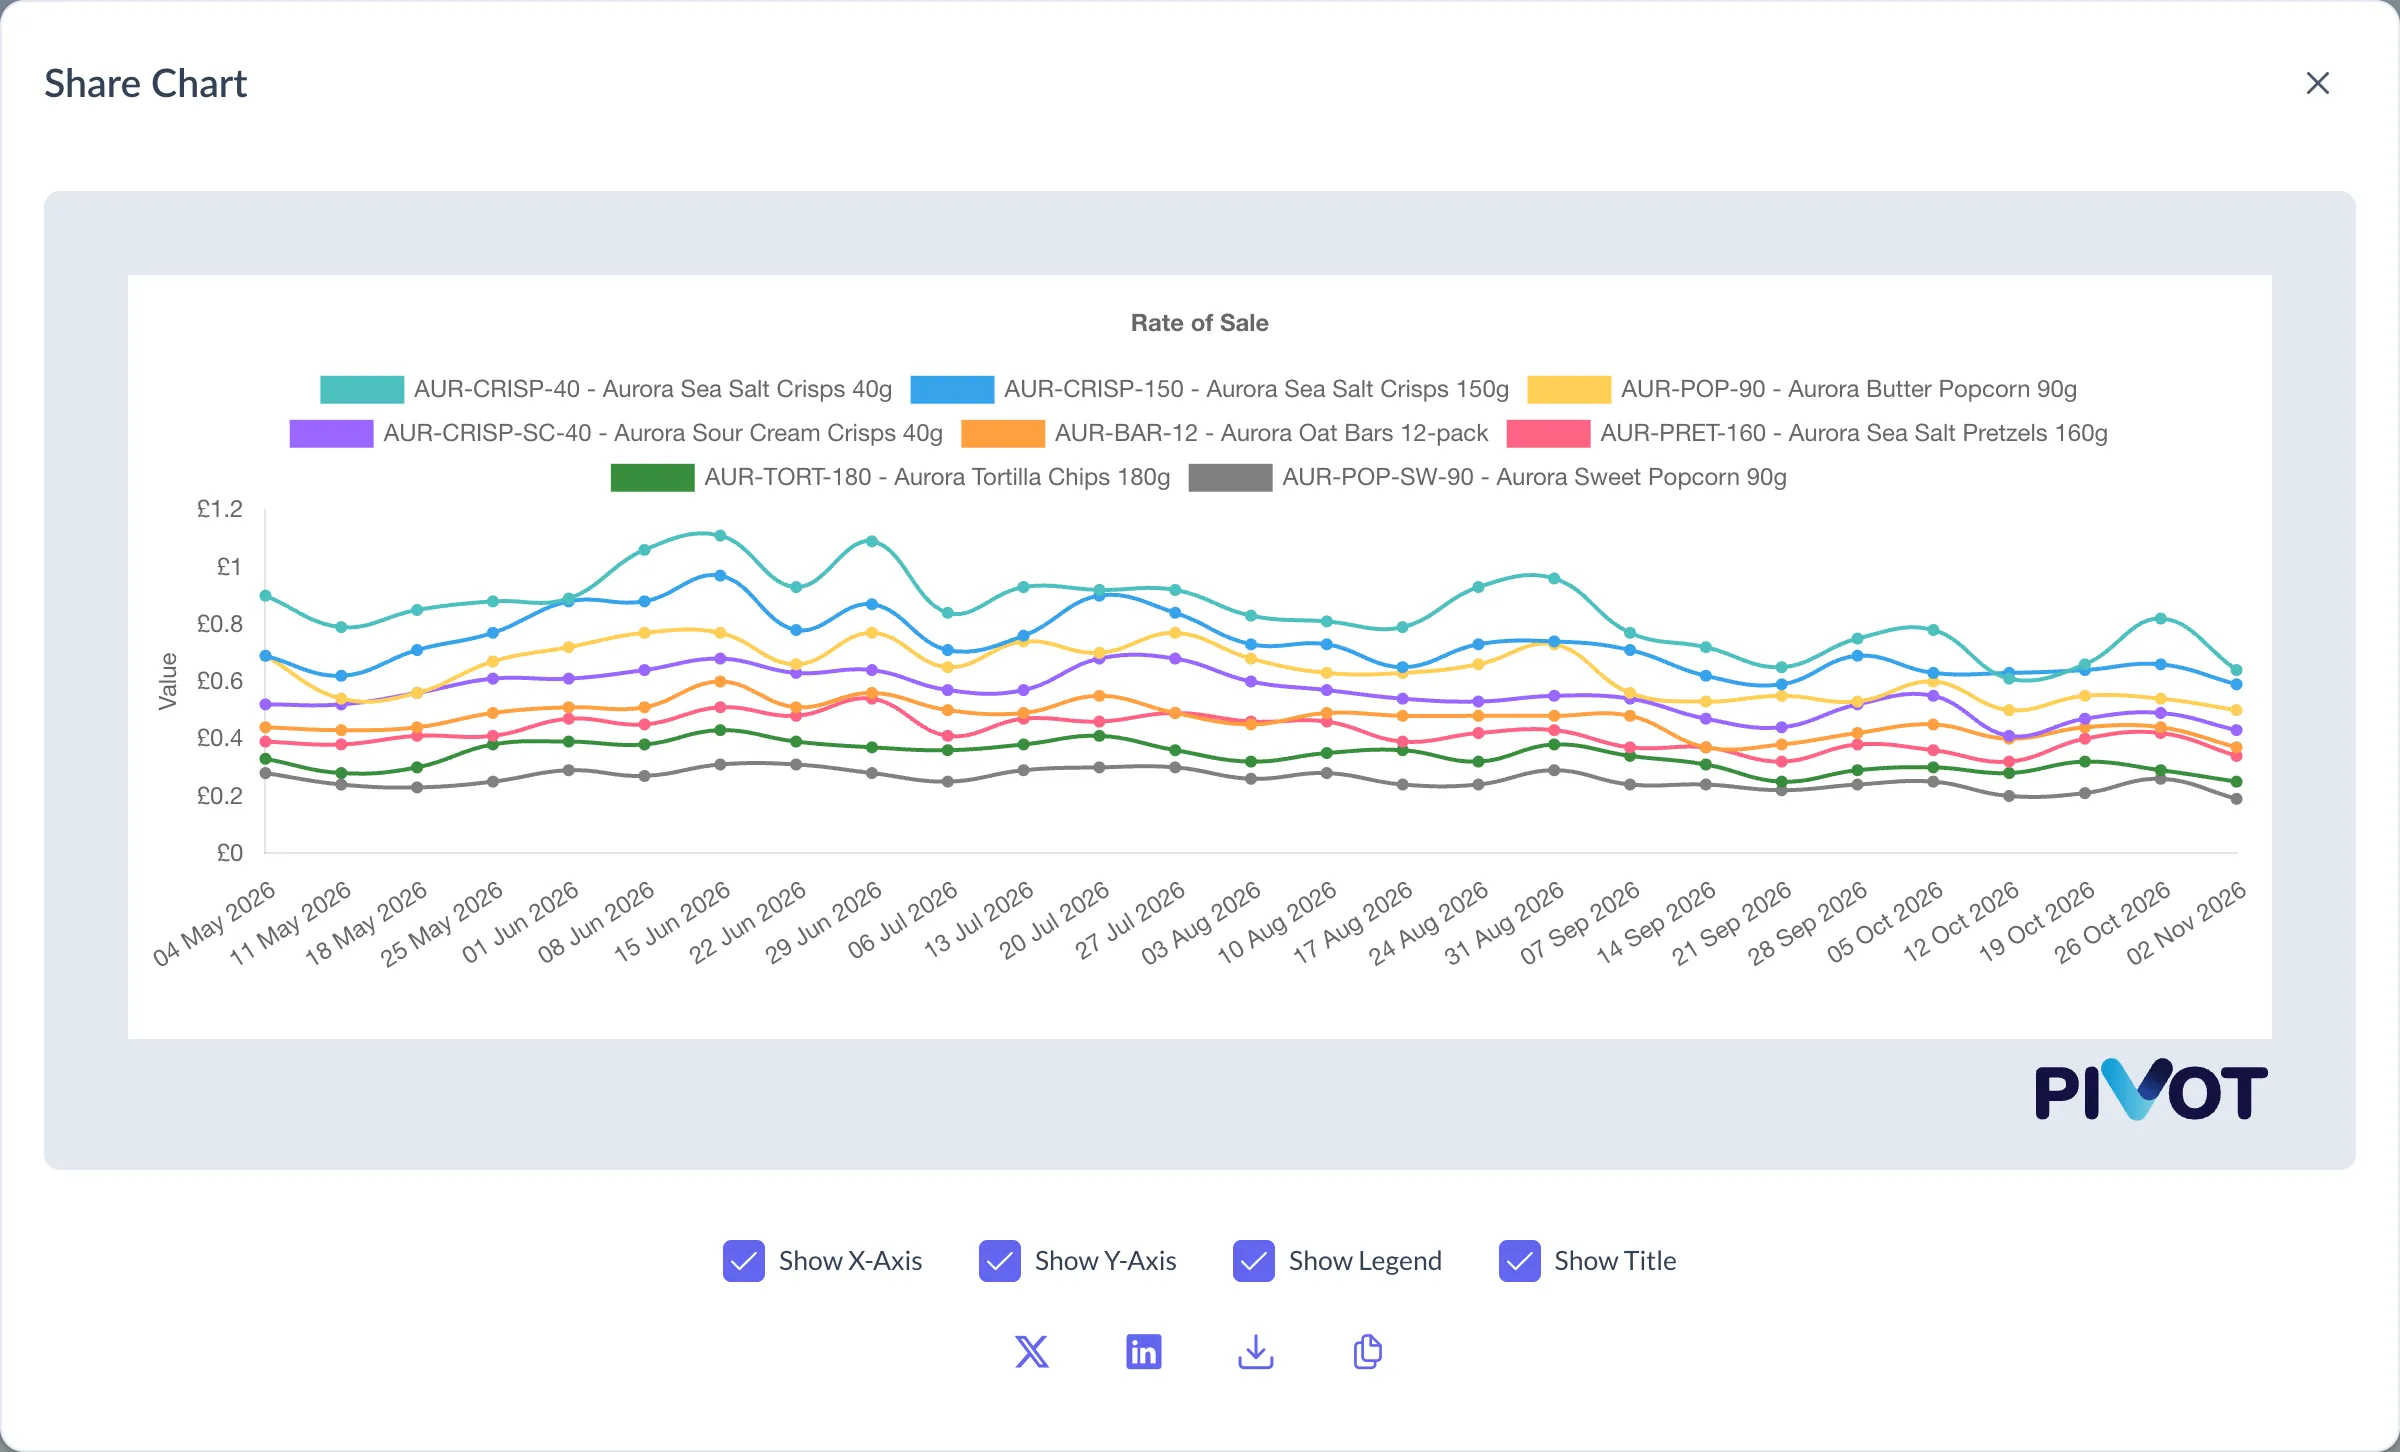
Share Chart, on demo data.
Related
Section titled “Related”- Account and access: downloading data, the Export page, light and dark mode.
- Troubleshooting: if a page or retailer is missing from the menu.