

Weekly Stores By
Weekly Stores By is a store-by-store table for a run of whole weeks. Each row shows one store’s revenue and units, how they changed on a comparison period, its share of your sales and, at most retailers, its stock. Use it to find your best and worst stores, and the stores that hold your stock but didn’t sell it.
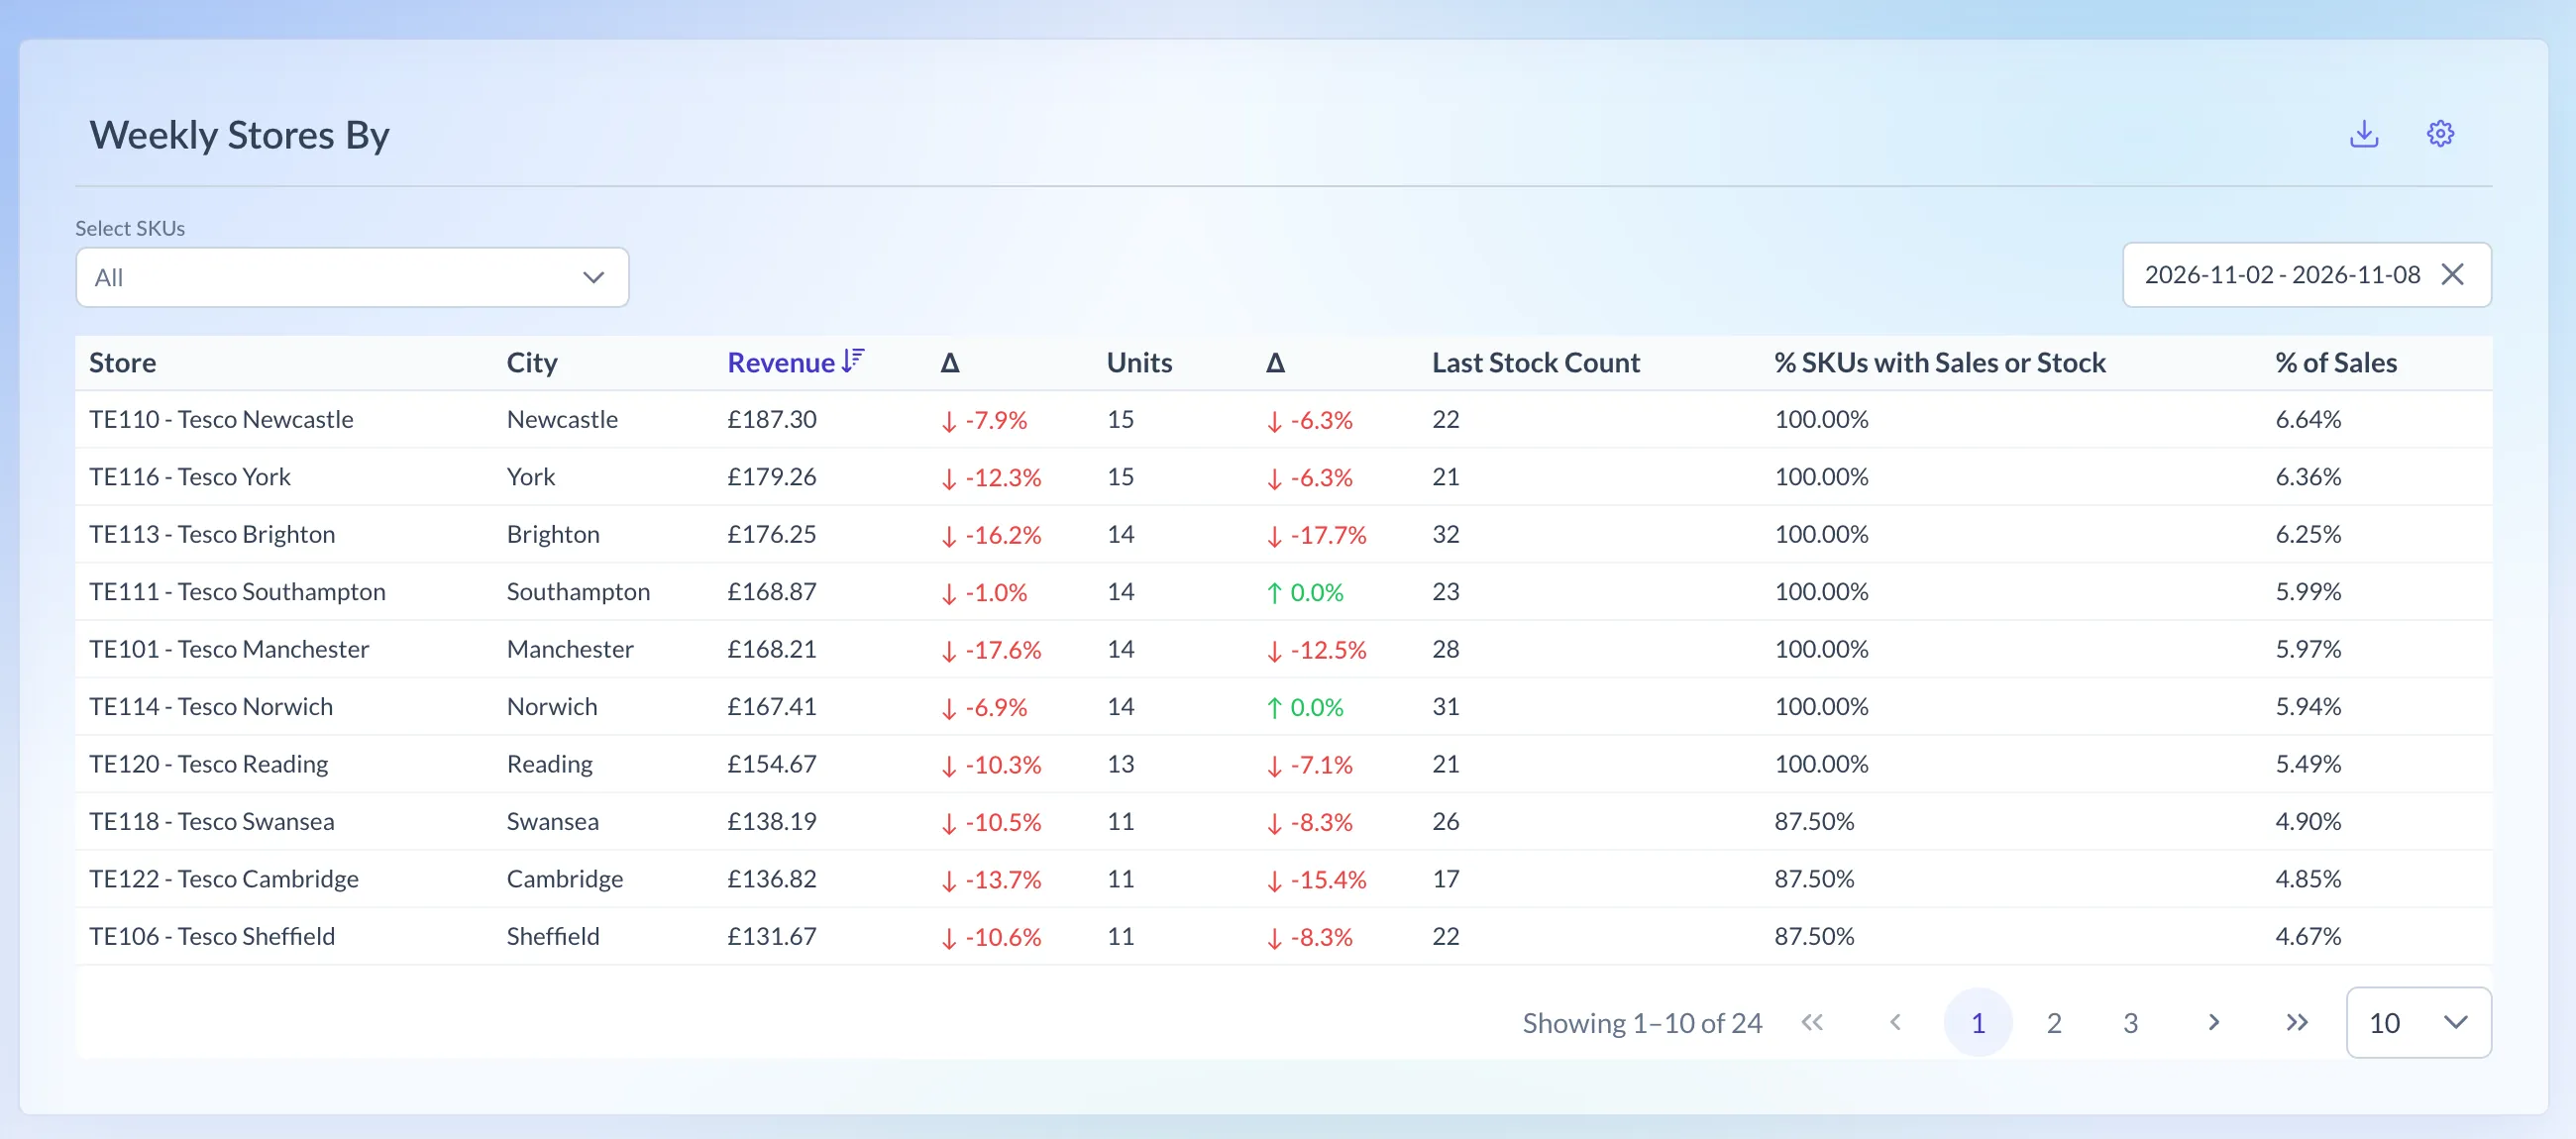
Shown on demo data.
What it shows
Section titled “What it shows”One row per store, highest revenue first. Click any column heading to sort by it.
- Store: the store number and name.
- Revenue and Units over the weeks you picked. A store that sold nothing shows a red No Sales tag.
- Δ: the change in revenue or units on the comparison period.
- Last Stock Count: units on hand at the store’s last stock count in your range.
- % SKUs with Sales or Stock and % of Sales: see below.
The list includes every store that sold or held stock, plus every other store at that retailer with a known location, marked No Sales. At Tesco that can be thousands of rows.
How it’s worked out
Section titled “How it’s worked out”Δ = (your range minus the comparison period) ÷ the comparison period × 100
- Previous period is the same number of days just before your range. Previous year is the same days 52 weeks earlier.
- Δ is shown to 1 decimal place. It shows a dash when the store has no sales, or nothing to compare with.
% SKUs with Sales or Stock = SKUs that sold or held stock at the store in your range ÷ SKUs that sold or held stock there in the 12 weeks to the end of your range
If your range is longer than 12 weeks, the whole range is used instead. That way a store isn’t marked down for SKUs it has never carried.
% of Sales = the store's revenue ÷ the revenue of every store that sold in your range × 100
With several SKUs picked, every figure is for those SKUs added together.
Which retailers have it
Section titled “Which retailers have it”- Asda
- Booths
- Morrisons
- Sainsbury’s
- Tesco
- Tesco ROI
- Waitrose
Booths and Waitrose don’t send store stock, so their table has no Last Stock Count or % SKUs with Sales or Stock. Holland & Barrett and CLF don’t send store-level sales, and Ocado is online only with no stores, so they don’t have this page.
Using the page
Section titled “Using the page”- In the menu, open a retailer and choose Weekly Stores By.
- In Select SKUs, pick one or more SKUs, or leave it on All.
- Click the date box, choose a start week and an end week, and click Apply. The page opens on the current week, which has little data yet, so pick a finished week.
- Click the cog (Settings) for the table settings. Changes apply straight away:
- Layout: Pivot by SKU gives each SKU its own group of columns. Pick at least one SKU first.
- Compare with: Previous period (the default) or Previous year.
- Stores: All stores (the default) or No sales, which lists only the stores that didn’t sell.
- Depots: Include depots is on by default. Tesco’s depots hold stock but don’t sell, so untick it to leave them out.
- Save keeps your SKUs and settings for this retailer next time. The weeks aren’t saved.
Download gives you a CSV of the table as laid out.
Reading the numbers
Section titled “Reading the numbers”- No Sales with a stock count means the store held your stock but sold none of it in your range.
- With Pivot by SKU, No sales keeps any store that sold nothing of at least one of the SKUs, which shows gaps in a range.
- A blank City is a store whose location isn’t known yet. It appears only in weeks it sold or held stock.