

Retailer Overview
Each retailer in the menu starts with an Overview page. It’s the quickest way to see how the latest week went at that retailer, which SKUs are carrying your range, and how sales have moved over recent months, before you open a full report.
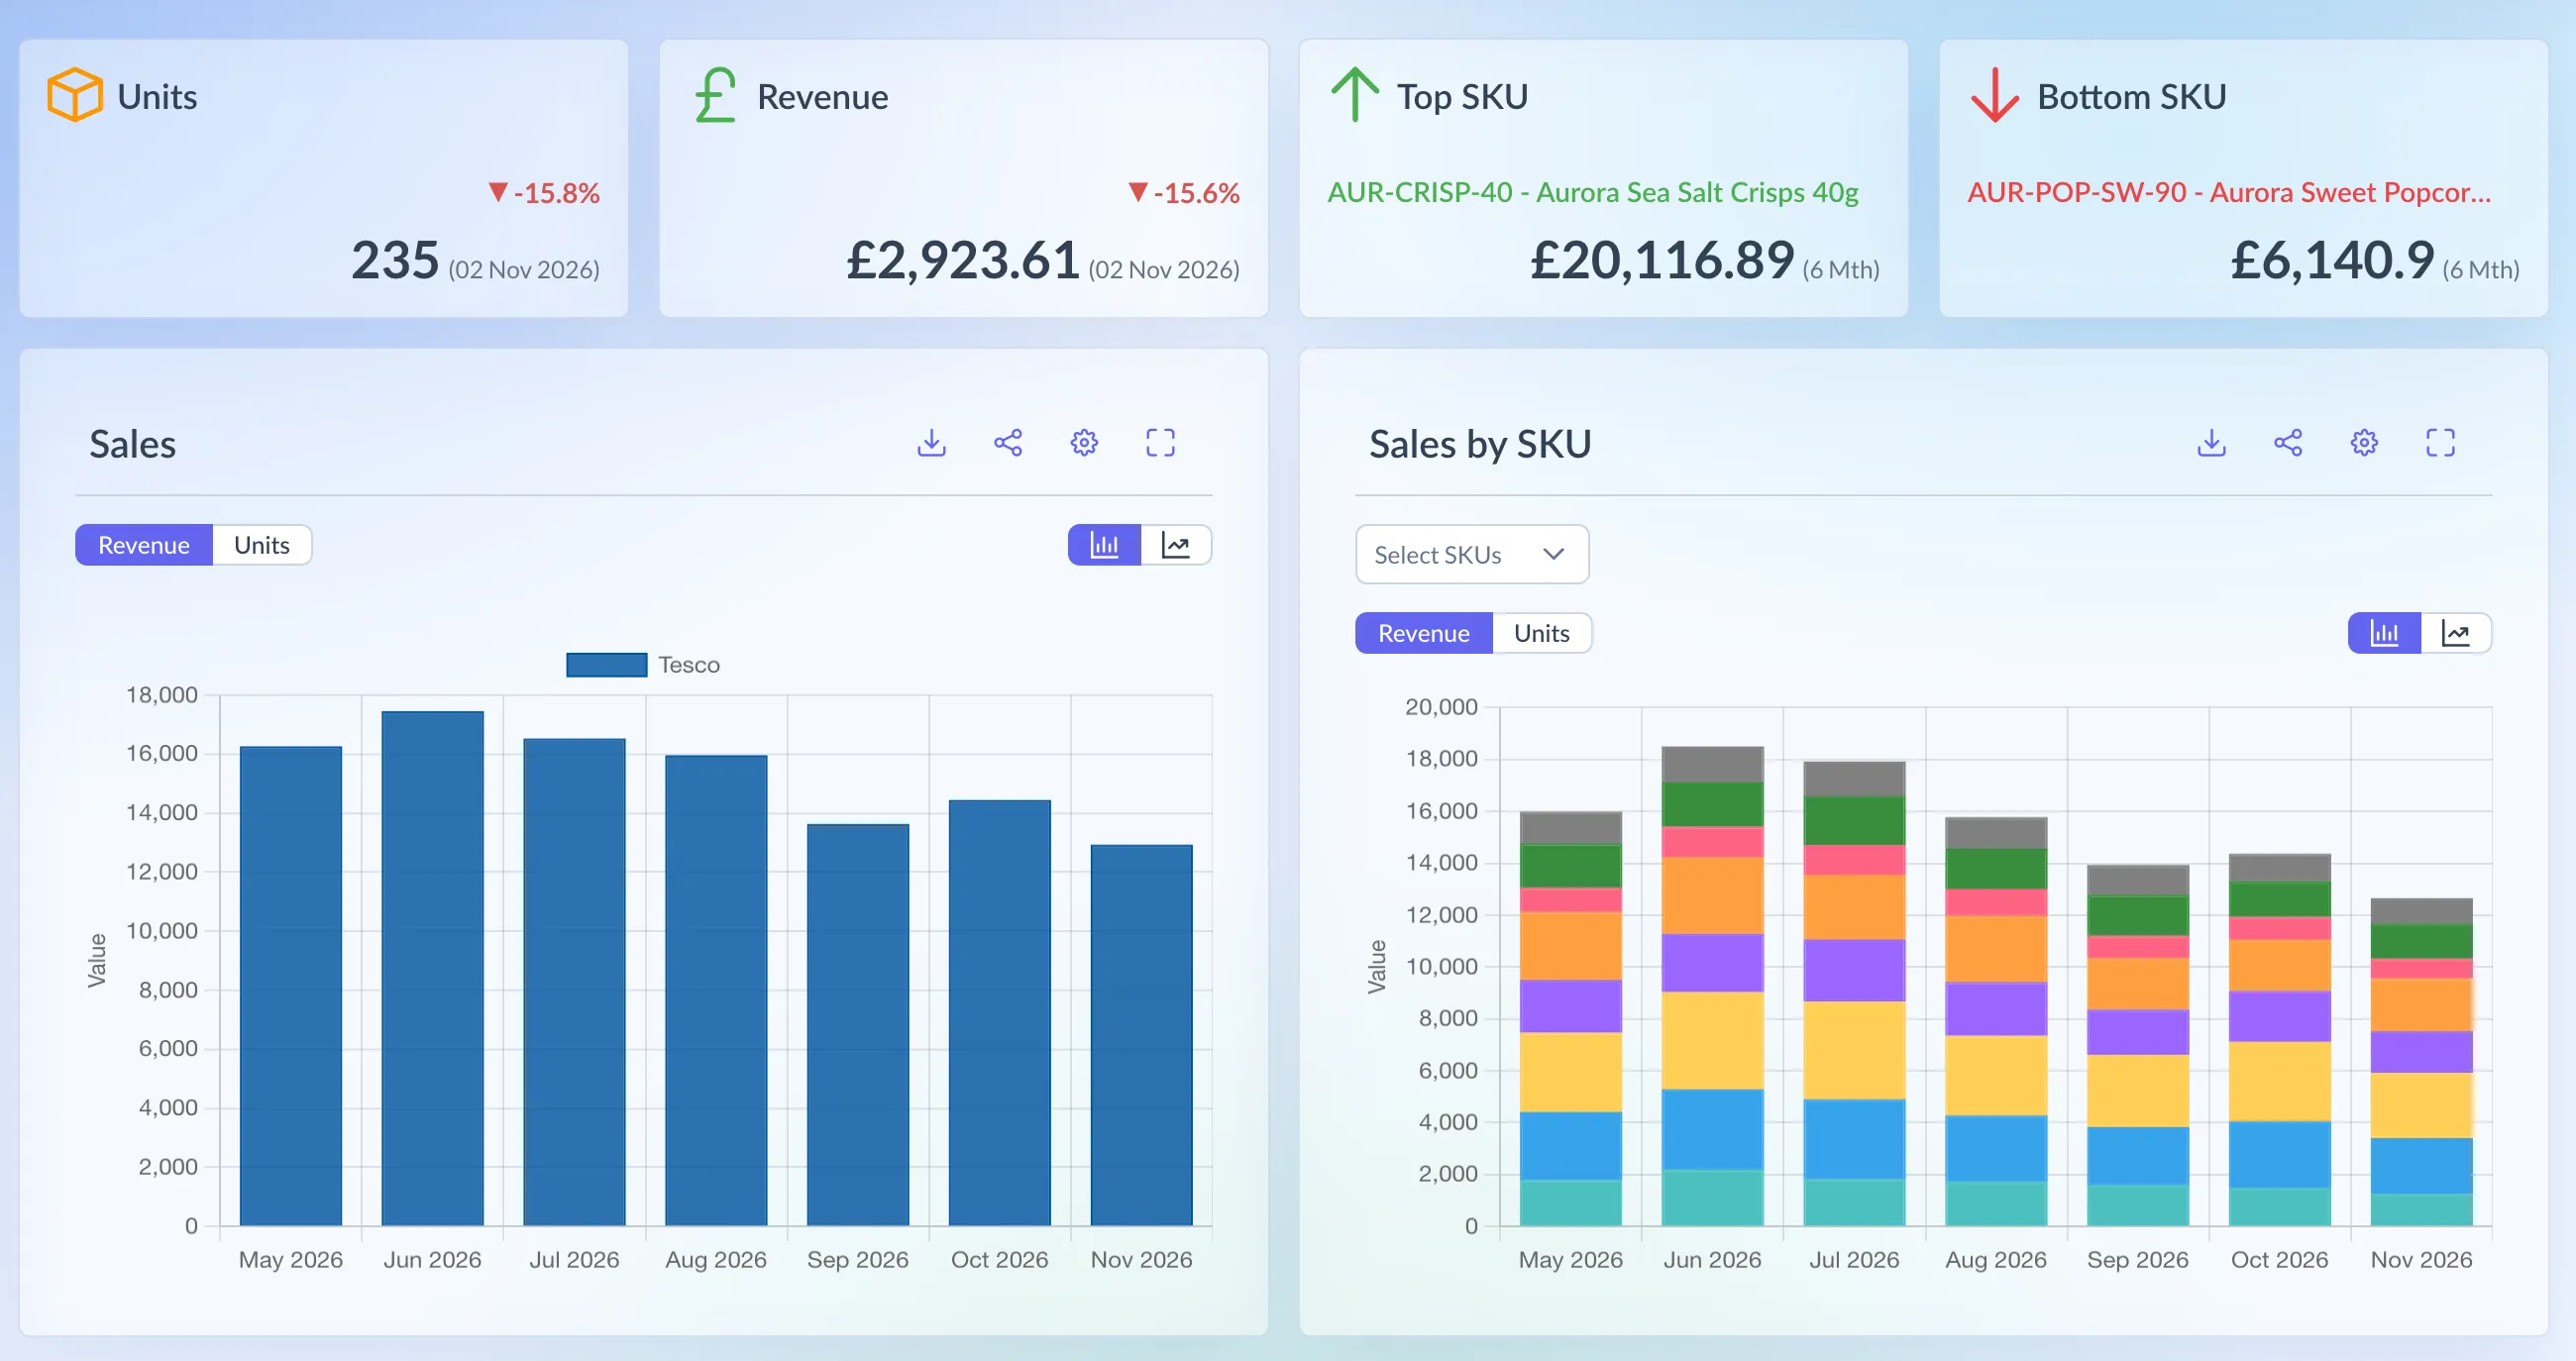
Shown on demo data.
What it shows
Section titled “What it shows”Four cards sit across the top:
- Units and Revenue: your total for the latest week the retailer has sent, with the change on the week before. The date in brackets is the Monday that week starts on.
- Top SKU and Bottom SKU: the SKUs with the most and the least revenue over the last 6 months (marked 6 Mth), with that revenue.
Below the cards are the retailer’s main charts. Each one works like its full page, with its own controls:
- Sales, at every retailer.
- Sales by SKU, at every retailer except Ocado.
- Rate of Sale, at Asda, Morrisons, Sainsbury’s, Tesco and Tesco ROI.
- Stores Selling, at Morrisons, Tesco and Tesco ROI.
How it’s worked out
Section titled “How it’s worked out”Change = (latest week minus the week before) ÷ the week before × 100
- The change is shown to 1 decimal place.
- The 6 months run from the 1st of the month six months ago up to the latest data.
- Top SKU and Bottom SKU are always ranked by revenue, even when a chart below is set to units.
Which retailers have it
Section titled “Which retailers have it”Every retailer has an Overview: Asda, Booths, CLF, Holland & Barrett, Morrisons, Ocado, Sainsbury’s, Tesco, Tesco ROI and Waitrose. You see the ones your brand is supplied at.
- Ocado reports sales by brand rather than by SKU, so its Overview shows just the Units and Revenue cards and the Sales chart.
- Booths has Rate of Sale and Stores Selling pages, but its Overview doesn’t include those charts. Open them from the Booths menu.
Using the page
Section titled “Using the page”- In the menu, open a retailer and choose Overview.
- Read the cards for the latest week and the last 6 months.
- On any chart, choose Revenue or Units and a bar or line chart. The cog (Settings) sets the Time frame and Date range.
- Save in the settings remembers that chart’s choices on this retailer’s Overview only. It doesn’t change the full pages, and they don’t change it.
- Full View opens the chart with a table of its figures underneath. Download gives you a CSV.
Reading the numbers
Section titled “Reading the numbers”- The latest week may not be finished. Retailers that send data daily fill in the current week as it goes, so early in the week the cards can show a fall against a full week. Check the Sales page by week if a drop looks wrong.
- Bottom SKU is often a SKU that has barely sold, or one that was delisted early in the six months. A SKU with no sales at all in that time isn’t counted.