

Store Performance
Store Performance puts every store at a retailer in one table. You choose one metric, such as revenue, stock or availability, and see it by week or by SKU. Use it to spot the stores doing well, the ones falling behind and, for one SKU, the stores where it’s ranged but not selling.
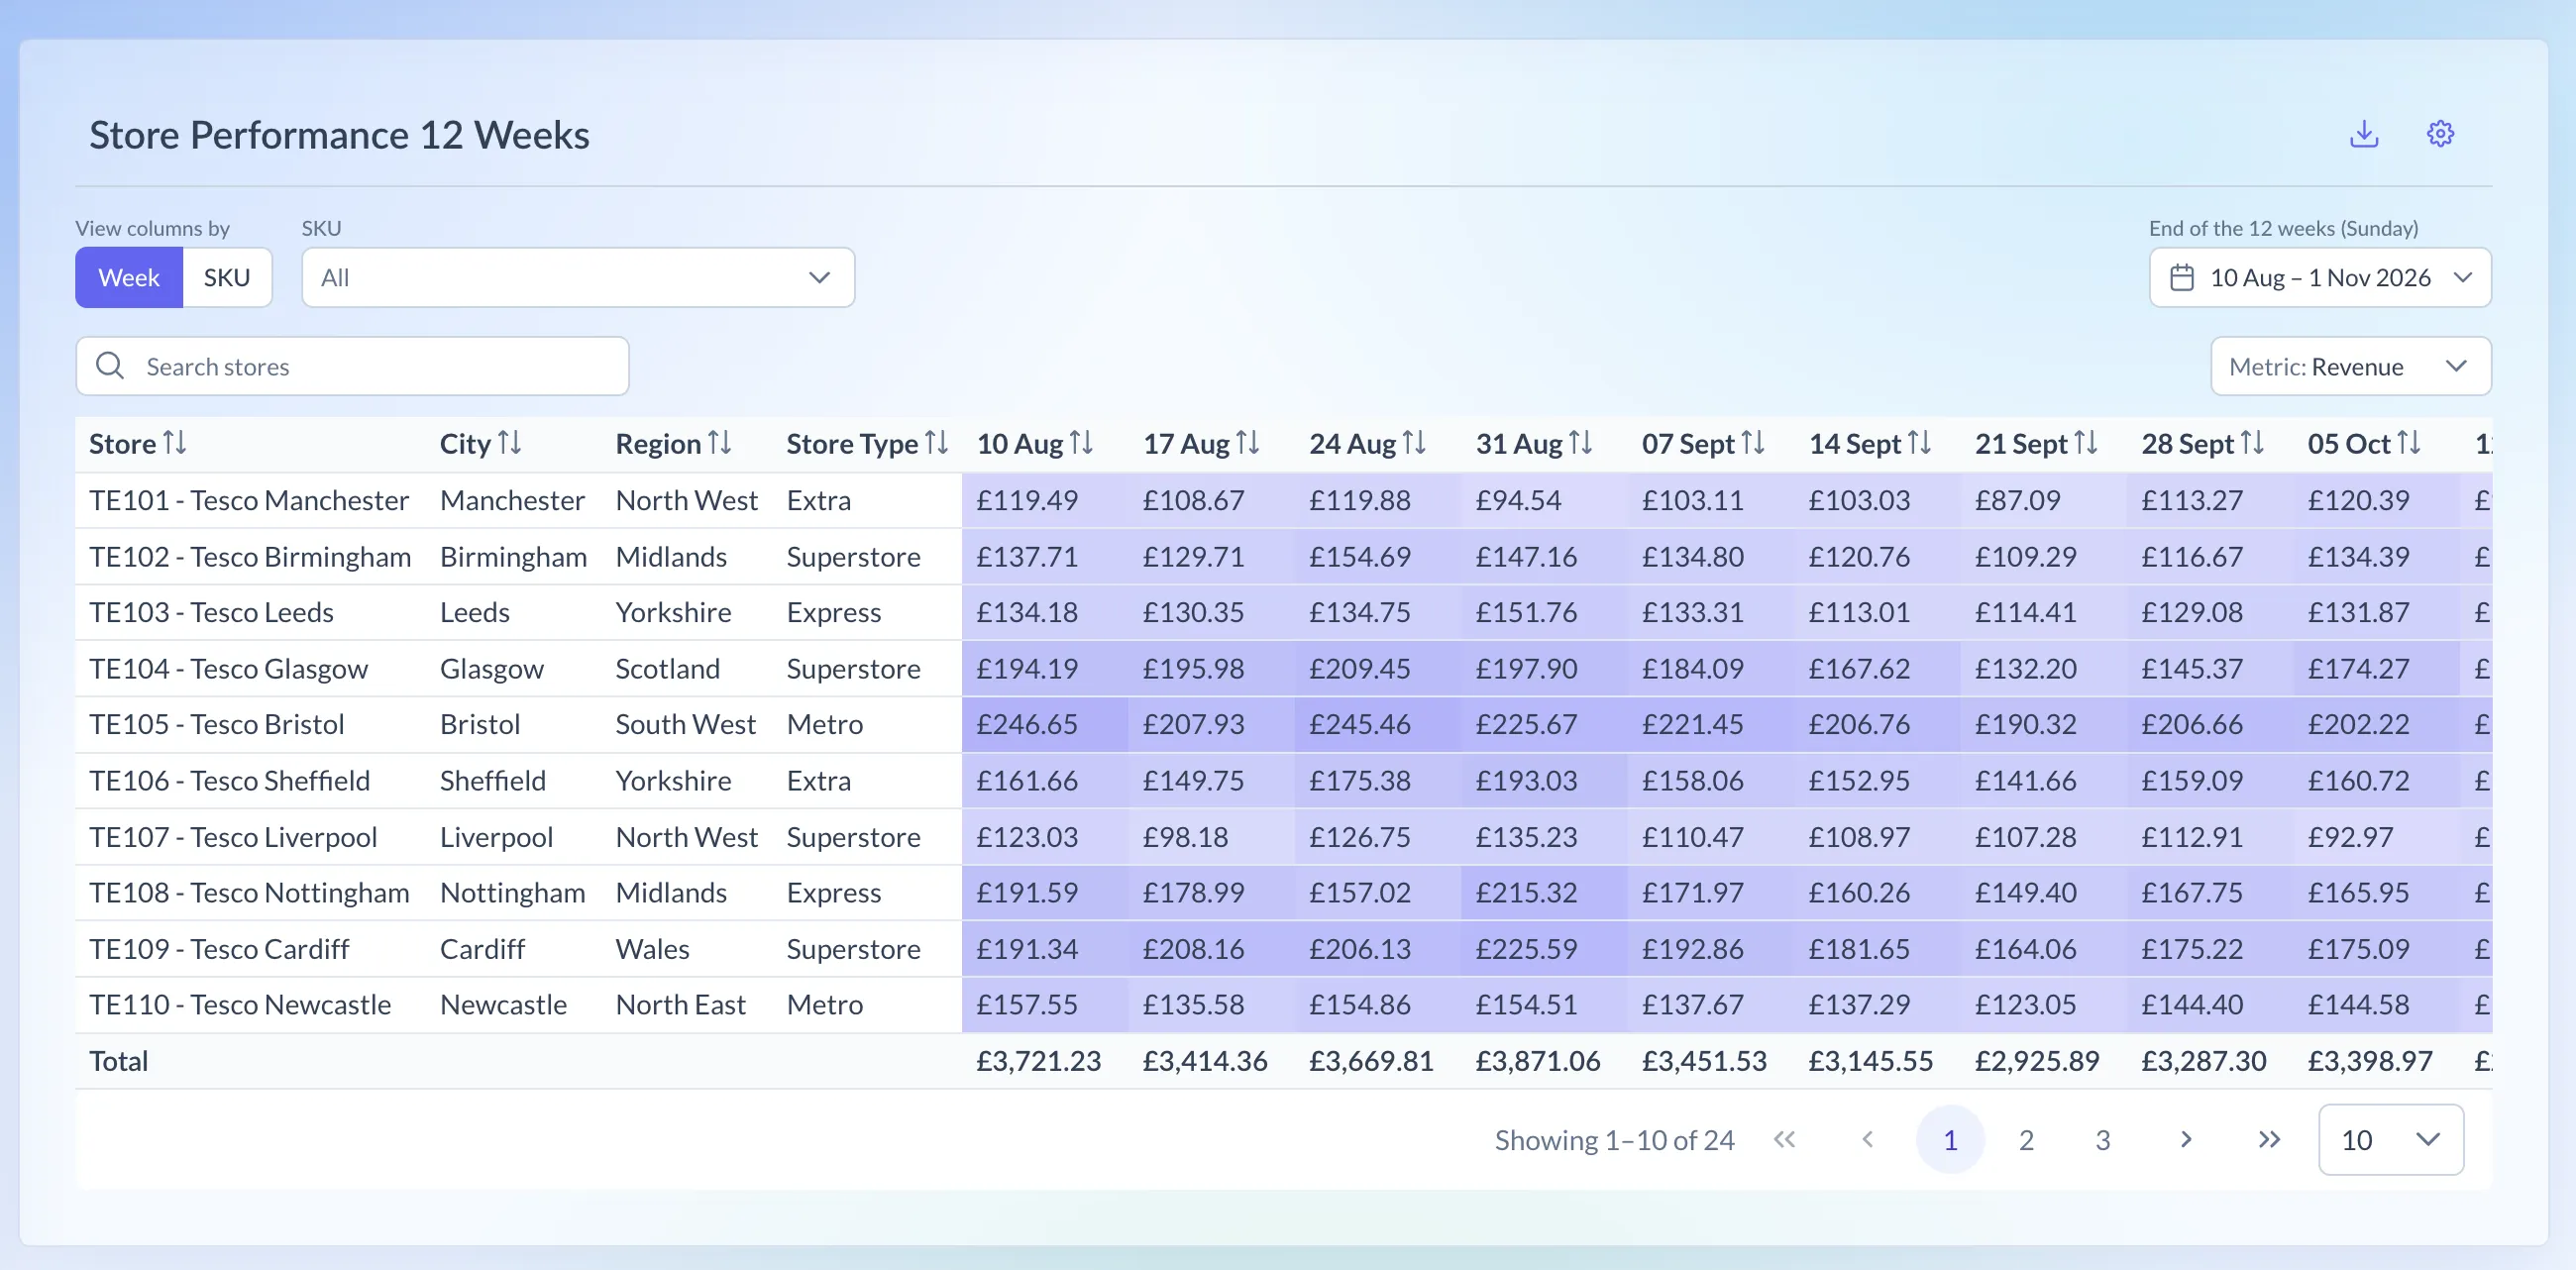
Shown on demo data.
What it shows
Section titled “What it shows”| Metric | What it is |
|---|---|
| Revenue, Units | Sales for the SKUs you’ve picked |
| Unit ROS, Value ROS | Rate of sale (see below) |
| % SKUs Selling | Your active SKUs that sold at the store |
| Stock | Units in stock at the week’s last stock count |
| % SKUs with Sales or Stock | Your active SKUs that sold or were in stock |
| Weeks Cover | How many weeks the stock would last |
| Availability % | The share of potential sales the store made |
| Lost Sales (units) | Units the store could have sold if fully in stock |
| Wastage £, Wastage % | What the retailer wrote off, and as a % of sales |
A metric the retailer doesn’t supply stays in the list, greyed out, with a Not supplied by badge. The two % SKUs metrics need weeks as columns.
How it’s worked out
Section titled “How it’s worked out”- Active SKUs are the SKUs that sold or held stock at the store in any week of the period, so a store isn’t marked down for SKUs it never carried.
- Unit ROS with weeks as columns is units ÷ the store’s active SKUs. With SKUs as columns, it’s units ÷ weeks in the period. Value ROS uses revenue.
- Weeks Cover is to 1 decimal place, and blank where nothing sold.
- Lost Sales prices each day a store was out of stock at its own rate of sale that week. At Tesco it adds the days a store couldn’t fully meet demand. A whole week with no stock and no sales isn’t counted, as it can’t be told apart from a delisting.
Weeks Cover = stock ÷ average weekly units over the last 4 weeks
Availability % = units sold ÷ (units sold + Lost Sales)
Which retailers have it
Section titled “Which retailers have it”- Asda
- Booths
- Morrisons
- Sainsbury’s
- Tesco
- Tesco ROI
- Waitrose
Booths and Waitrose don’t send store stock, so they have no Stock or Weeks Cover. Availability and Lost Sales are at Tesco, Tesco ROI, Morrisons and Sainsbury’s. Wastage is at Tesco, Waitrose and Booths, and at Morrisons as a total only. Holland & Barrett doesn’t send sales by store, CLF has no stores and Ocado is online only, so they don’t have the page.
Using the page
Section titled “Using the page”- In the menu, open a retailer and choose Store Performance.
- Under View columns by, choose Week (12 weeks) or SKU.
- Choose one or more SKUs under SKU, or leave it on All.
- Pick the weeks. With Week, set End of the 12 weeks (Sunday). With SKU, set the Period. Both start on the 12 weeks to the end of last week.
- Choose a Metric. It starts on Revenue. Search stores narrows the rows.
- Under Settings, Include depots (on by default) lists the retailer’s depots. Save keeps it for this retailer.
Download CSV saves the table. With SKUs as columns, the table takes up to 60 SKUs with sales, so narrow the SKU list if you have more.
Range Conformance
Section titled “Range Conformance”Pick exactly one SKU at Asda, Booths, Morrisons, Sainsbury’s or Tesco and a Range Conformance column appears:
- Ranged, selling: ranged, and sold in the period.
- Ranged, not selling: ranged, but sold nothing.
- Not ranged, selling: sold, though not ranged.
- Not ranged, stock held: not ranged and sold nothing, but still holds stock. Booths sends no stock, so it never shows there.
Ranging comes from the latest week in the period that has it. A line above the table gives the counts.
Reading the numbers
Section titled “Reading the numbers”- Shading runs from light for the lowest value in the table to dark for the highest.
- The bottom row is a Total for sums and an Average for rates and percentages. Wastage % totals as all waste ÷ all sales. Weeks Cover has none.