

Wastage
Wastage shows what a retailer lost on your SKUs through write-offs and markdowns, split the way it reports them. Set against sales, it shows which SKUs waste the most and whether waste is rising.
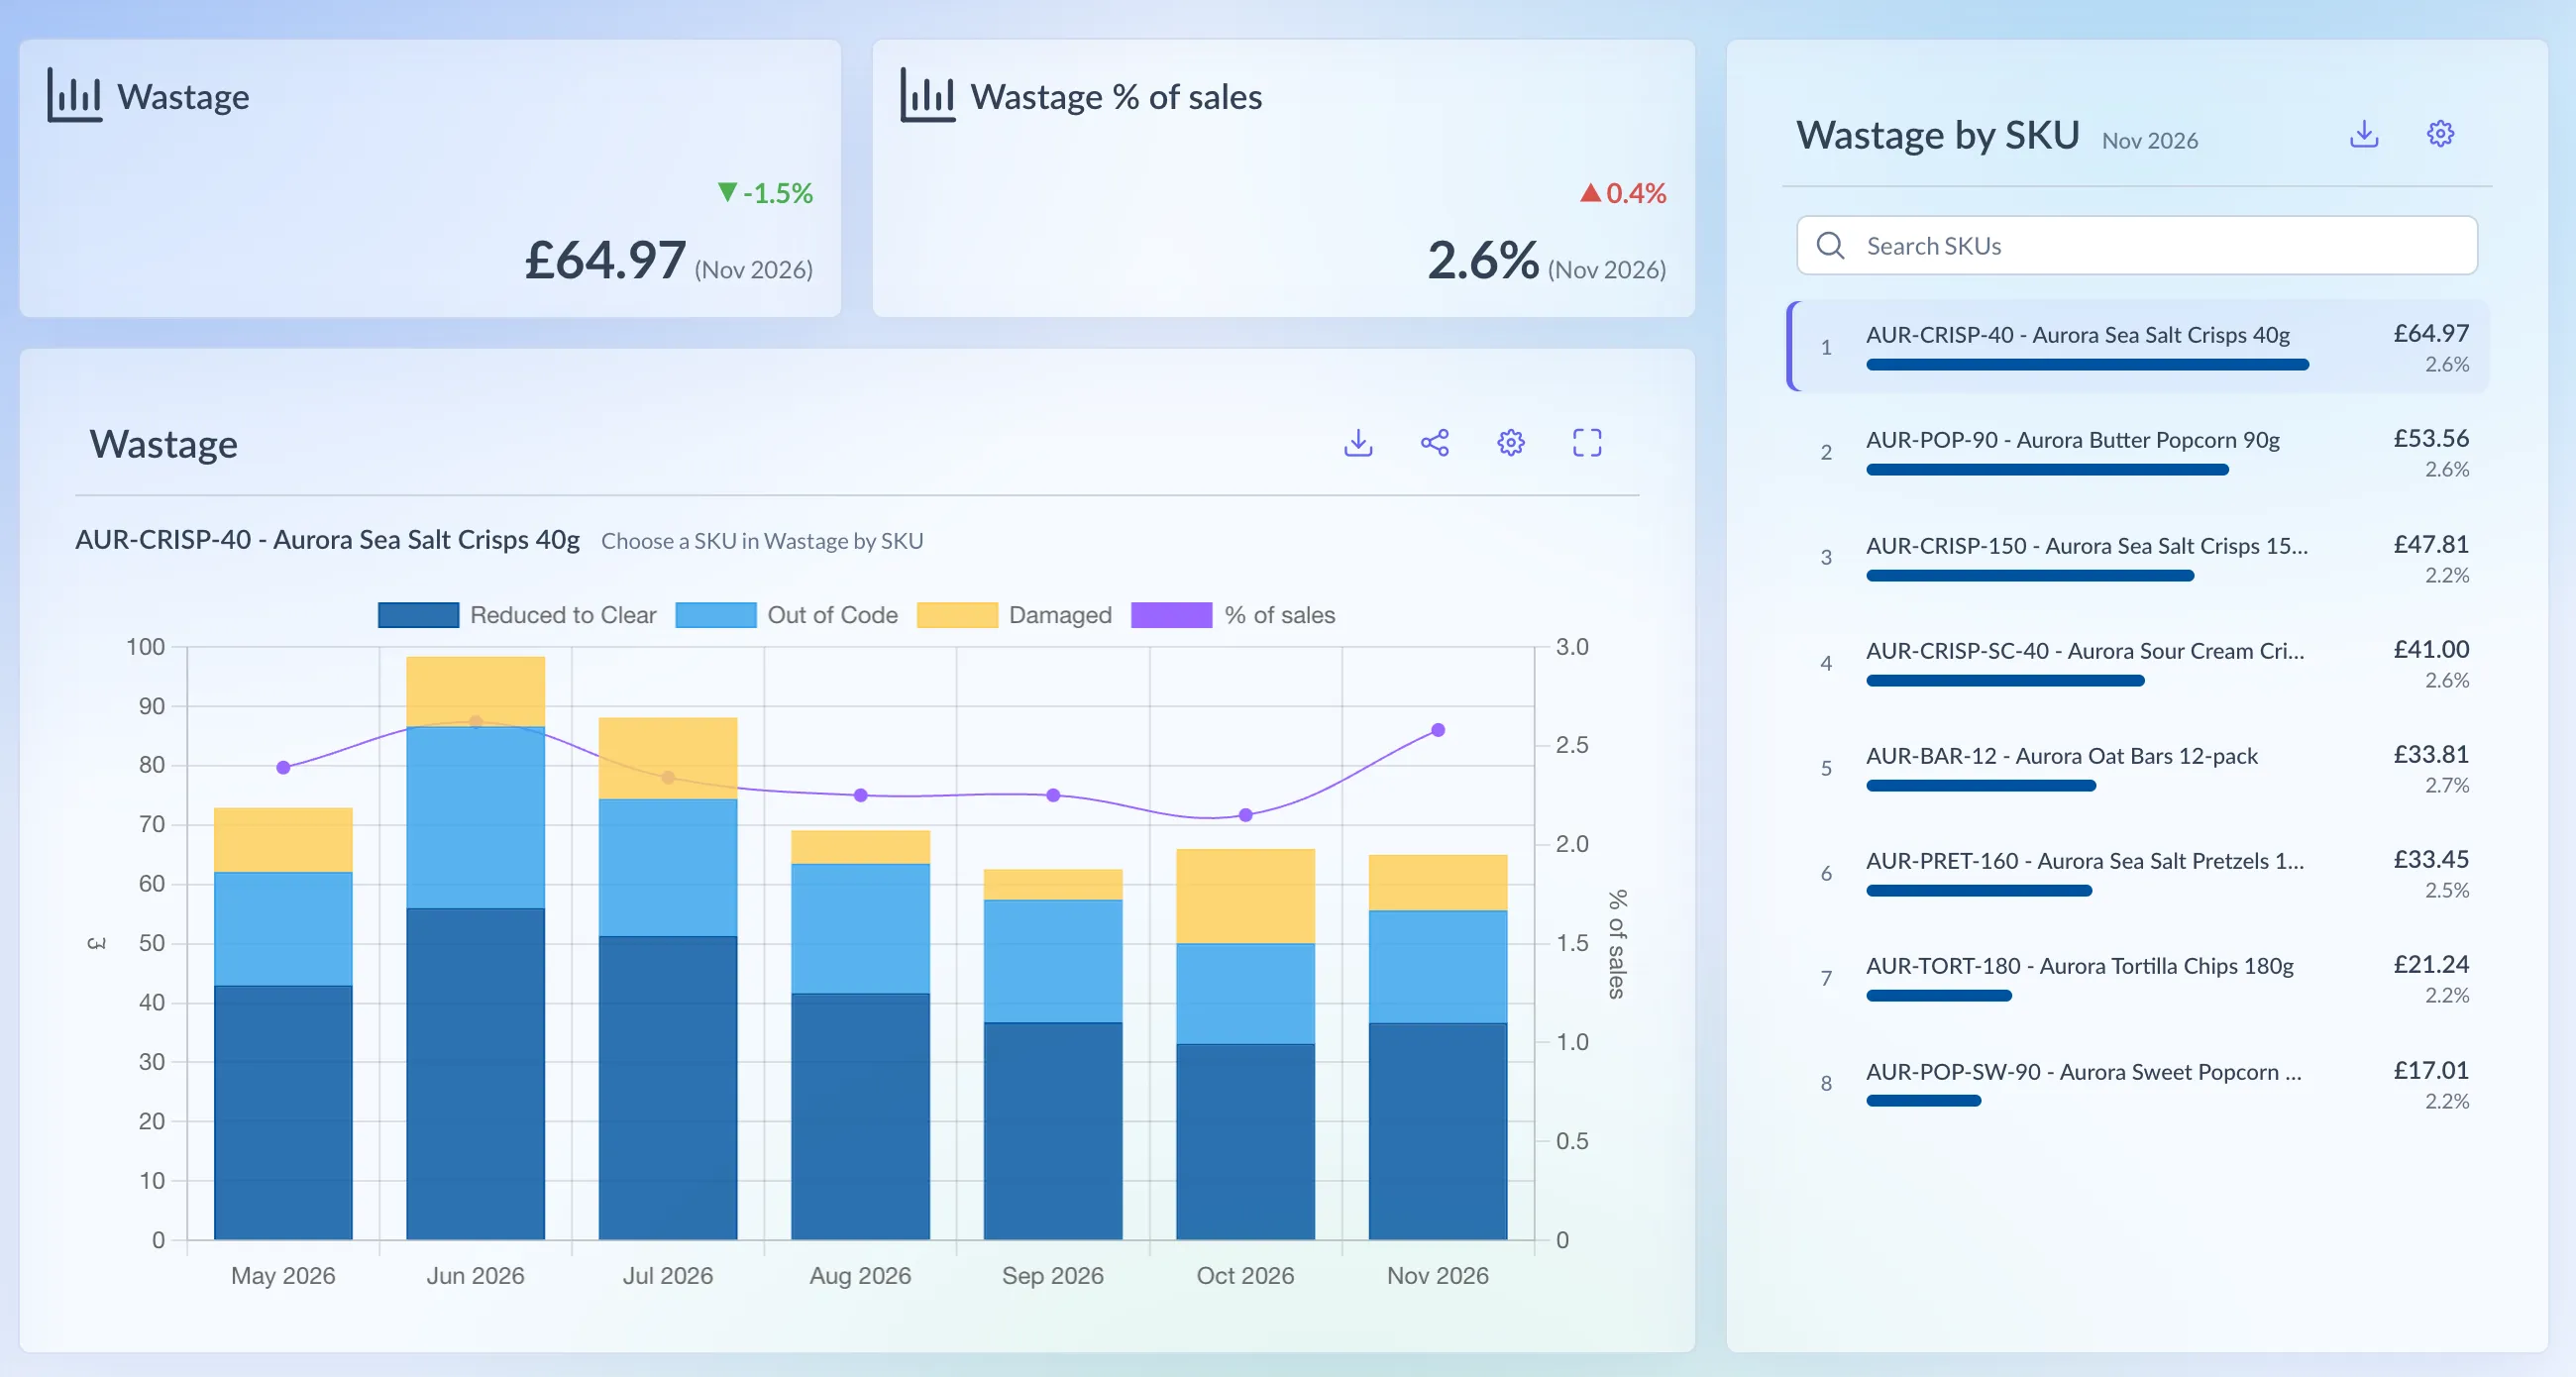
Shown on demo data.
What it shows
Section titled “What it shows”Each retailer has its own categories, which aren’t comparable across retailers. The total is the £ of its categories added up.
| Retailer | Categories | Units |
|---|---|---|
| Tesco | Reduced to Clear, Out of Code, Damaged | No |
| Waitrose | Reduced, Explained wastage, and Explained quality (part of Explained wastage) | No |
| Morrisons | Wastage, Markdown | Yes |
| Booths | Wastage, Markdown | Yes |
- Markdowns (Reduced to Clear, Reduced, Markdown) are the discount given on units that still sold. Write-offs (Out of Code, Damaged, Explained wastage, Wastage) are stock written off.
- Waitrose’s Explained quality is already inside Explained wastage, so the chart shows the rest of Explained wastage as “Explained wastage (other)” and the bars still add up to the total.
- At Morrisons and Booths, markdown can be negative.
How it’s worked out
Section titled “How it’s worked out”Wastage % of sales = wastage £ ÷ sales £ × 100
- Both are totalled for the same SKU and period before dividing, never averaged.
- A period with wastage but no sales shows the £ with no %.
Which retailers have it
Section titled “Which retailers have it”- Booths
- Morrisons
- Tesco
- Waitrose
Asda, Sainsbury’s, Tesco ROI, Holland & Barrett, CLF and Ocado don’t send us wastage, so they have no Wastage page.
Using the page
Section titled “Using the page”- In the menu, open a retailer and choose Wastage. Or press Ctrl K (⌘K on a Mac), type “wastage” and pick the retailer.
- Choose a SKU in Wastage by SKU on the right. It’s the only SKU selector on the page, and the page opens on the top-ranked SKU. Use Search SKUs to find one.
- For Morrisons and Booths, choose Value or Units.
- Open the settings (the cog) on the chart to pick the Time frame, Monthly (the default) or Weekly, and the Date range: All, 6 Months (the default), 12 Months or Custom. Save remembers your choices.
Waitrose sends wastage a week at a time (Sunday to Saturday), so its page is weekly only and has no Time frame choice.
Reading the numbers
Section titled “Reading the numbers”- The cards show Wastage £, Wastage % of sales and, for Morrisons and Booths, Units, for the latest week or month, with the change on the one before. For the %, the change is the difference between the two percentages.
- The chart stacks the retailer’s categories as bars, with % of sales as a line on the right-hand axis.
- Wastage by SKU ranks every SKU by wastage £ for the latest week or month, largest first, with its % of sales. Choosing a SKU never changes the ranking.
- In the list’s settings, tick Show SKUs with no wastage to list the retailer’s other SKUs at £0.00 below the ranking.
Download on the chart gives a CSV of the trend, and on the list a CSV of the ranking.
History starts in July 2024 for Tesco, September 2024 for Waitrose, and January 2025 for Morrisons and Booths.
For wastage by store, use Wastage £ and Wastage % on Store Performance (Tesco, Waitrose and Booths; Morrisons as a total only).