

Rate of Sale
Rate of Sale shows how much each SKU sells per store, per week. A SKU in 900 stores will nearly always sell more in total than one in 90, so total sales flatter the SKUs with the widest distribution. Rate of Sale takes that out, so you can see which SKUs genuinely move.
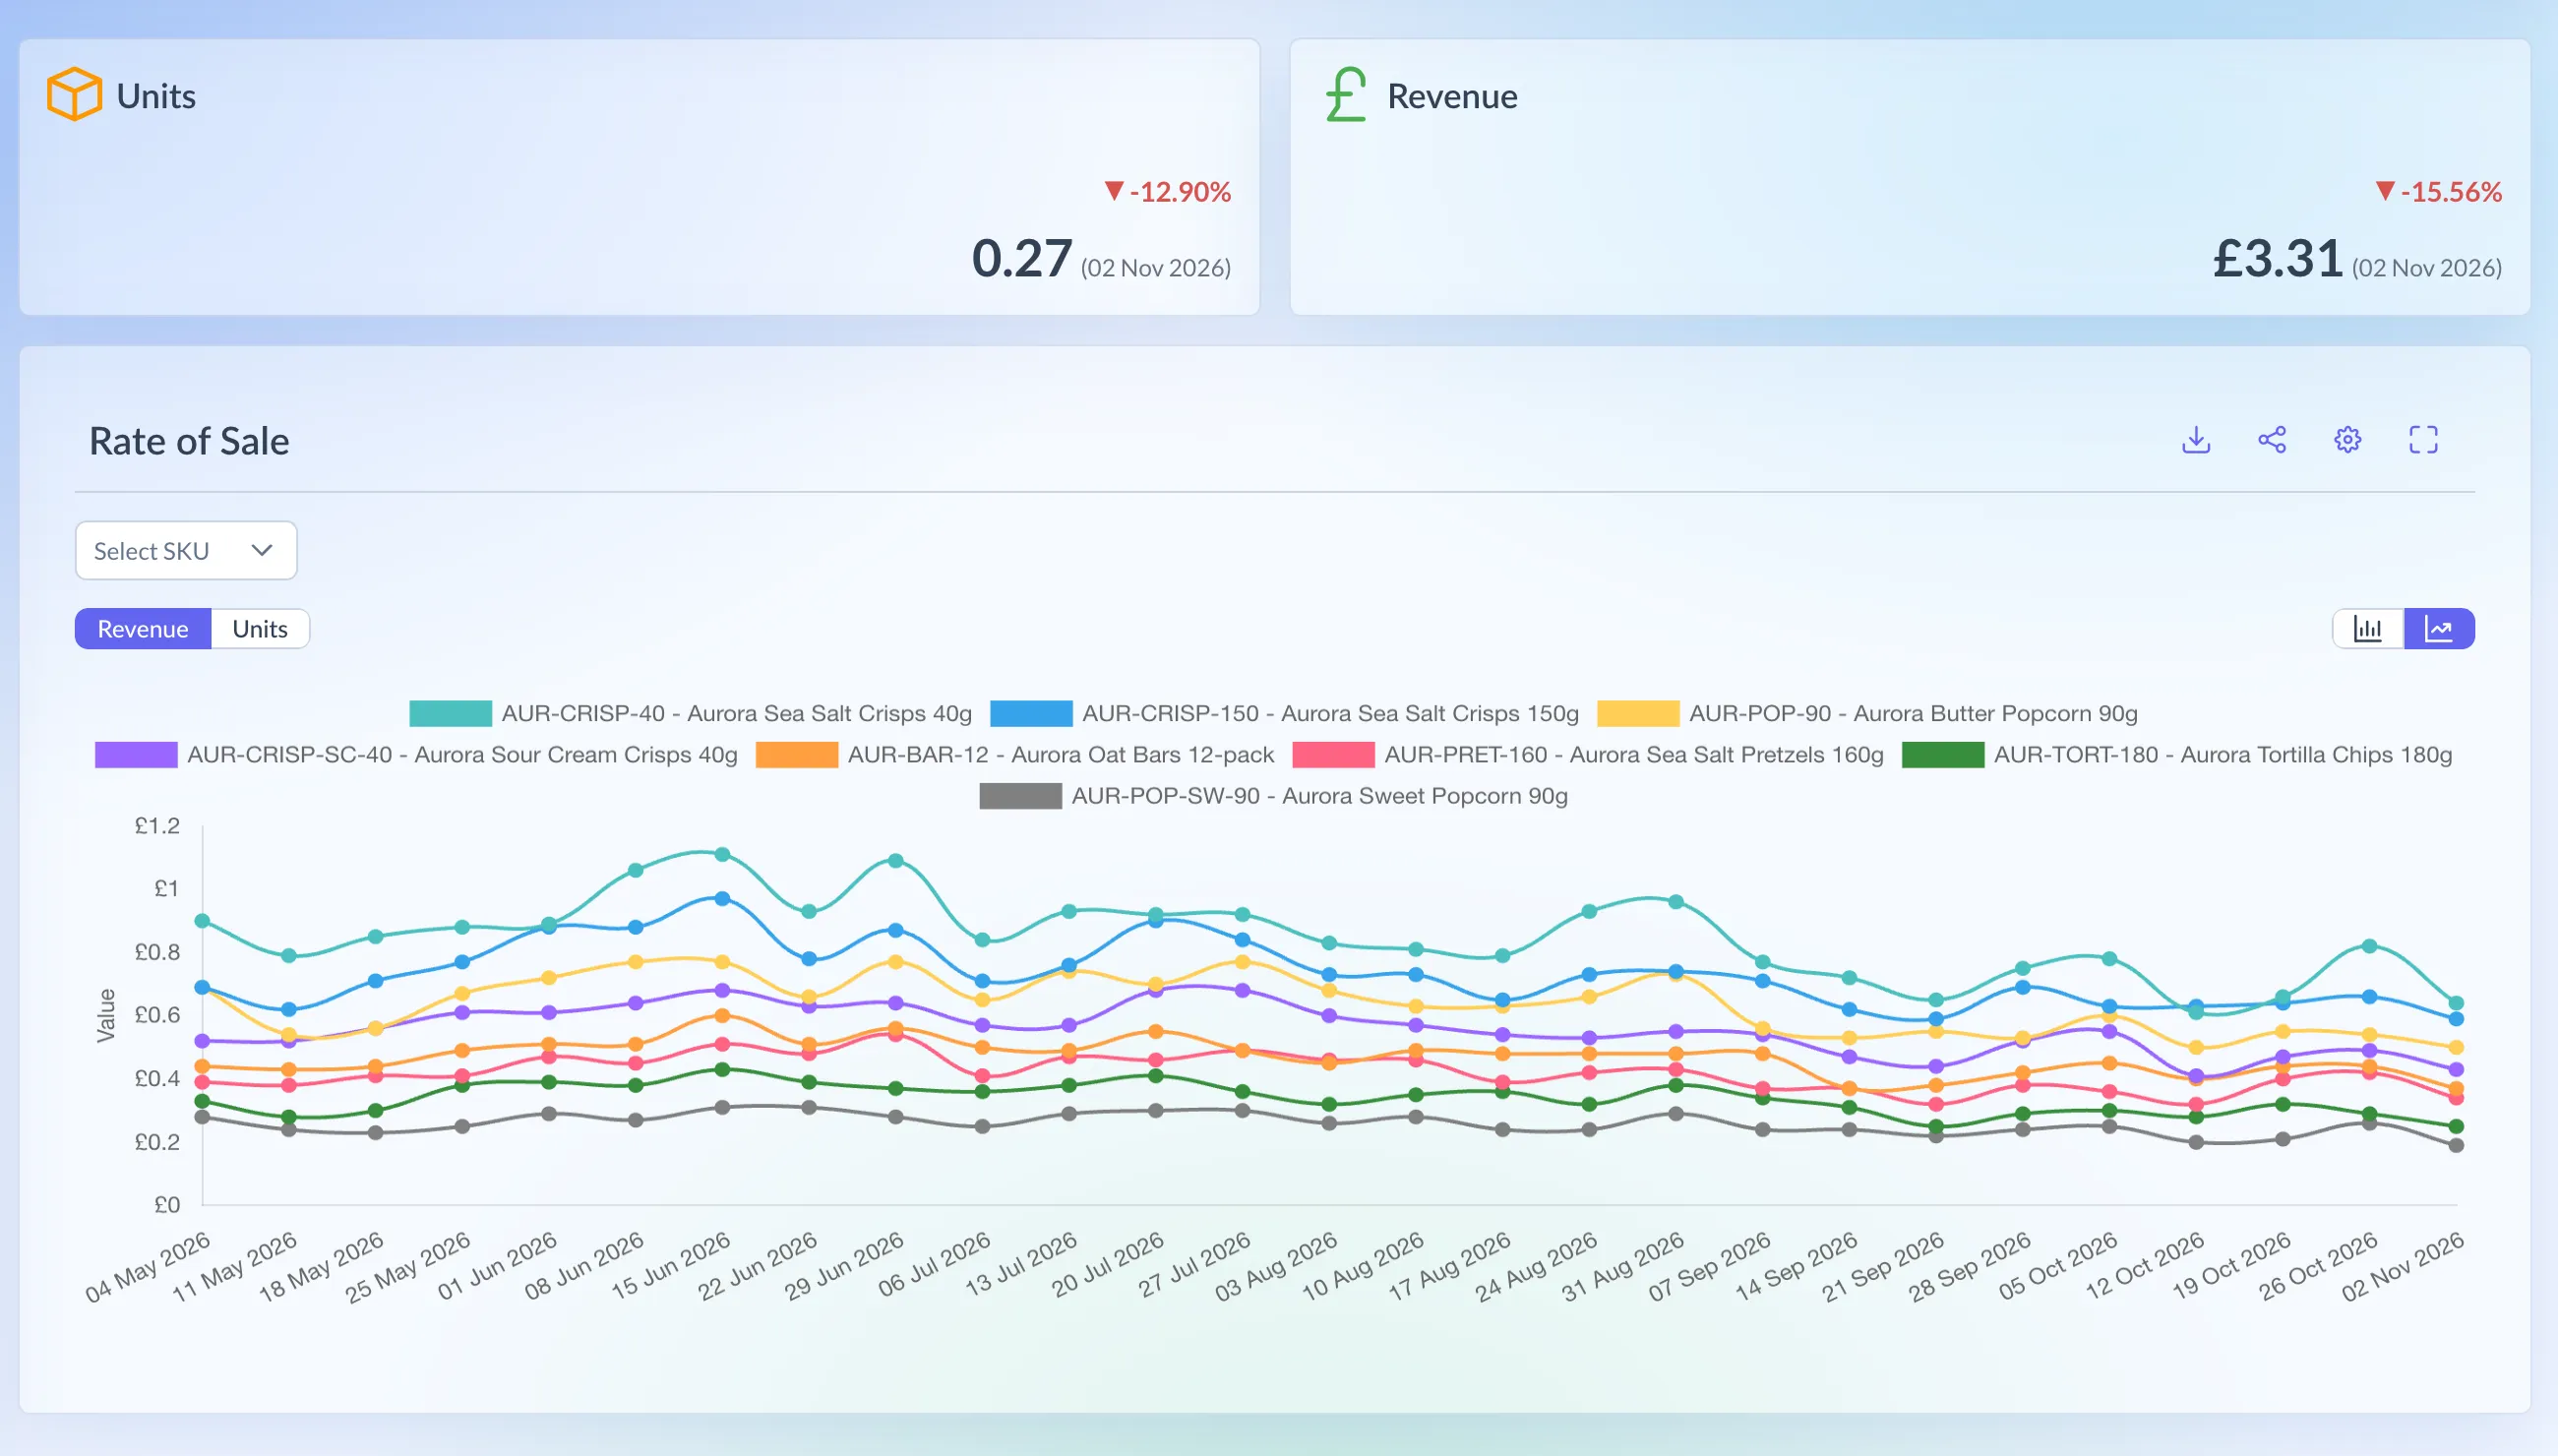
Shown on demo data.
How it’s worked out
Section titled “How it’s worked out”Rate of sale = the SKU's sales in the week ÷ the stores that sold it or had it in stock that week
- It’s worked out separately for each retailer, SKU and week.
- Units uses units sold. Revenue uses sales value, so it reads as £ per store.
- A store counts if, on any day of the week, it sold the SKU or had stock of it. At Asda and Booths, a store where the SKU is listed or ranged counts too.
- Figures are rounded to 2 decimal places.
Which retailers have it
Section titled “Which retailers have it”Rate of Sale needs store-level data, so it’s available for:
- Asda
- Booths
- Morrisons
- Sainsbury’s
- Tesco
- Tesco ROI
Waitrose, Holland & Barrett and CLF don’t send store-level stock, and Ocado is online only with no stores, so they don’t have a Rate of Sale page.
Using the page
Section titled “Using the page”- In the menu, open a retailer and choose Rate of Sale. Or press Ctrl K (⌘K on a Mac), type “rate of sale” and pick the retailer.
- Choose a SKU, or leave it on all of them.
- Choose Revenue or Units, and a line or bar chart.
- In the settings, pick the date range: the last 6 months (the default), 12 months, all, or your own dates. A longer range smooths out one-off weeks.
The page is always weekly. In the settings, Save remembers your choices for next time.
Reading the numbers
Section titled “Reading the numbers”- The chart has one line per SKU, with a point for each week. A week with no figure shows as 0.
- The cards at the top show the latest week and the change on the week before.
- The table has a row per SKU and a column per week, with a Total row underneath.
Download gives you a CSV with a row per week and a column per SKU.