

Sales
The sales pages show what shoppers bought of your products, as revenue (£) or units, by week or by calendar month. Use them to follow a retailer’s trend, see which SKUs drive it, and compare retailers and years.
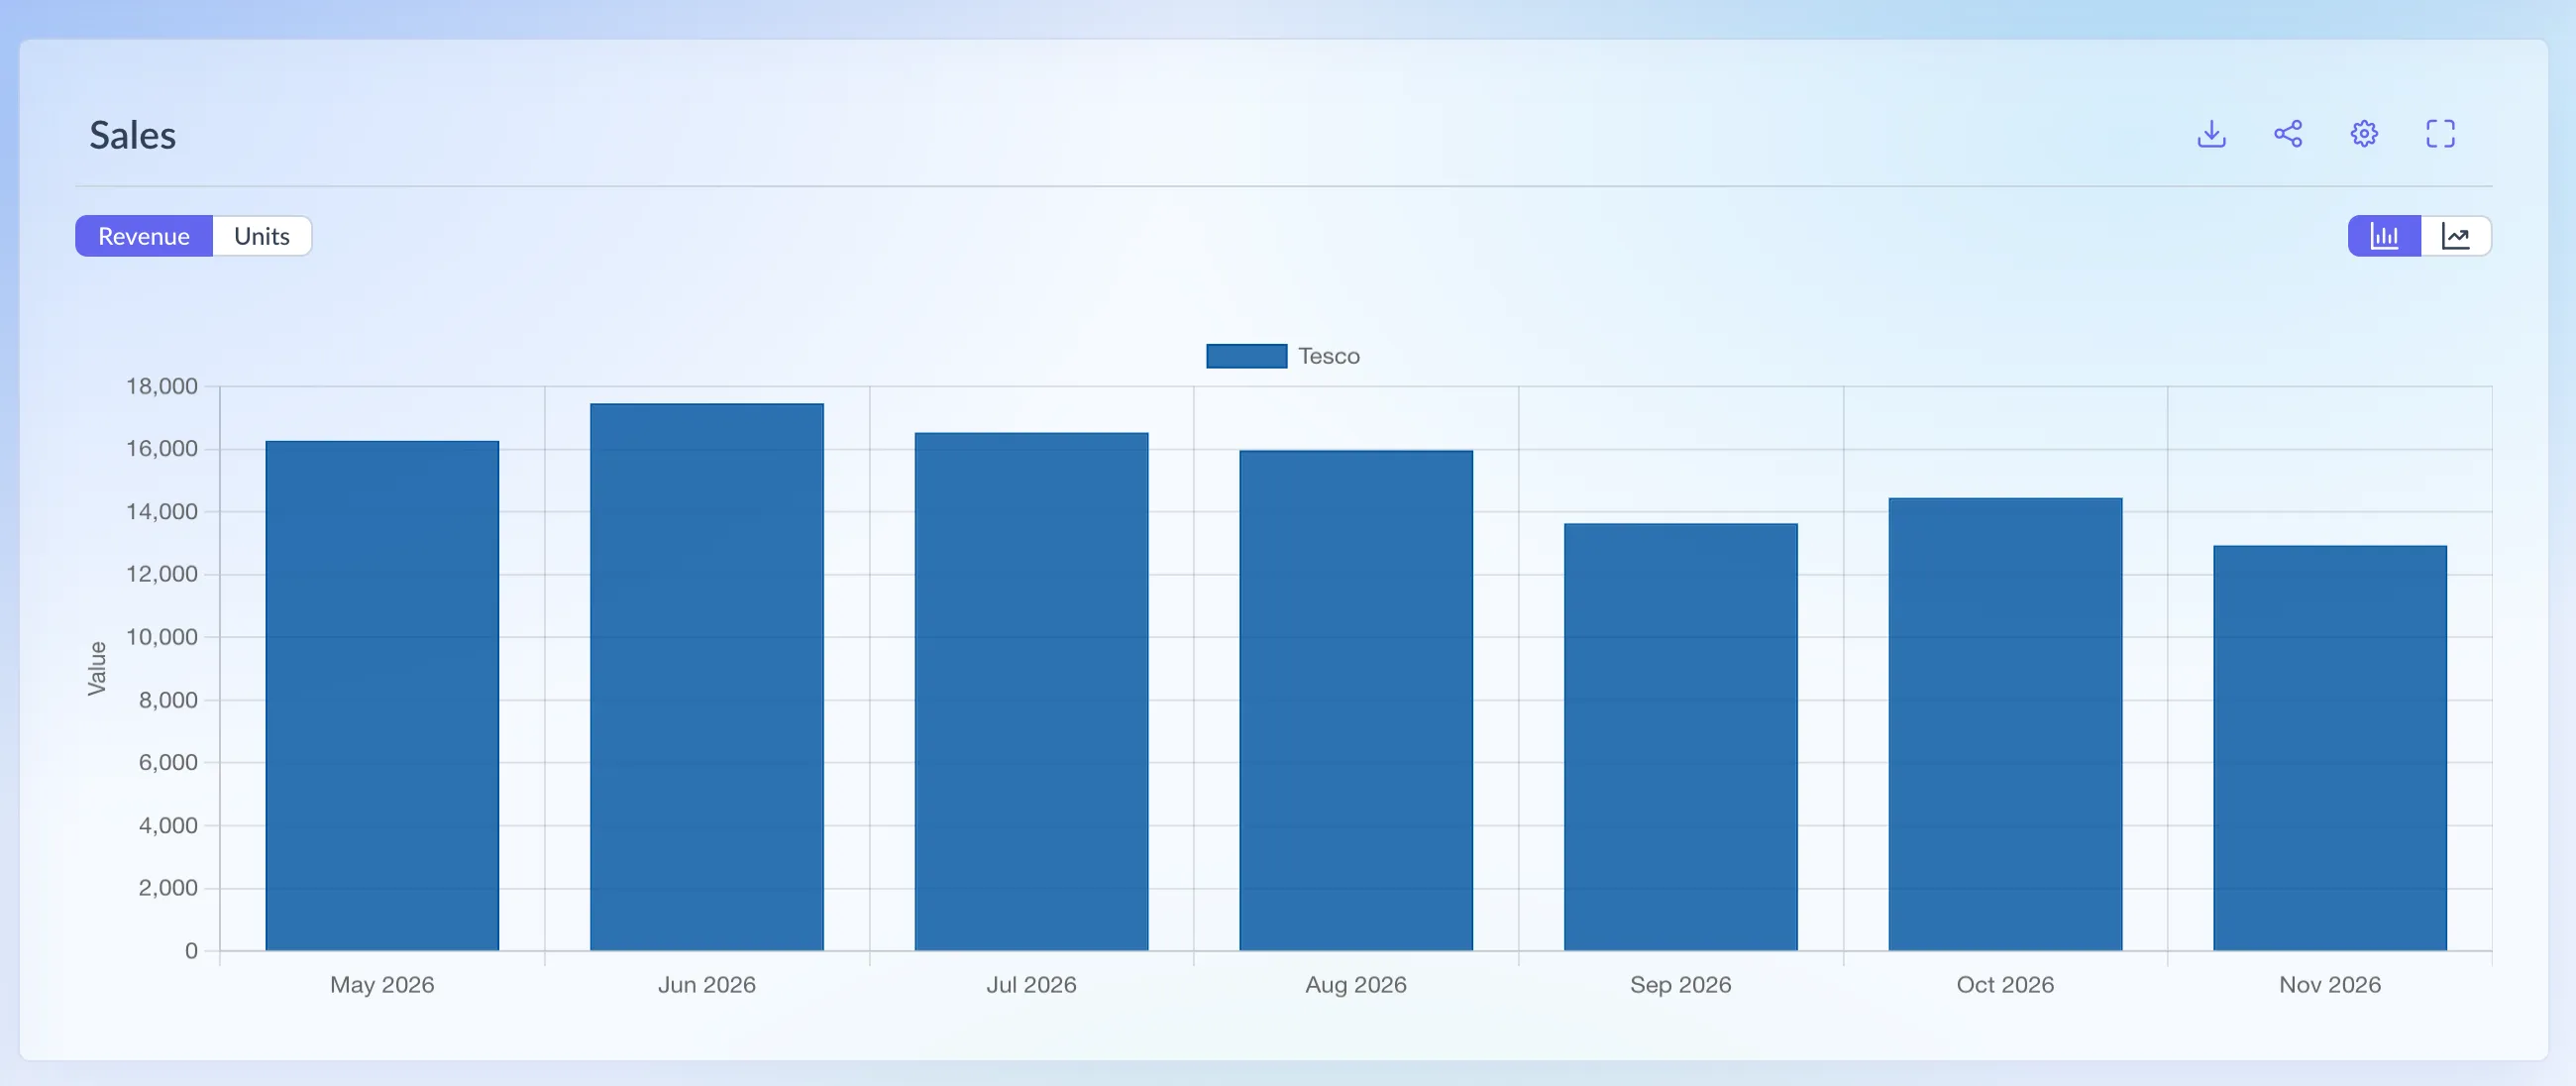
Shown on demo data.
What it shows
Section titled “What it shows”Each retailer’s menu has three sales pages:
- Sales: one bar or point per week or month, for all your SKUs.
- Sales by SKU (bar icon): one series per SKU, stacked when shown as bars. Cards on top show Units and Revenue for the latest period with the change on the one before, and the Top SKU and Bottom SKU over the date range.
- Sales by SKU (pie icon): each SKU’s share of the date range. The top 10 get a slice each and the rest are added together as Other.
The two Sales by SKU items have the same name. The icon tells them apart.
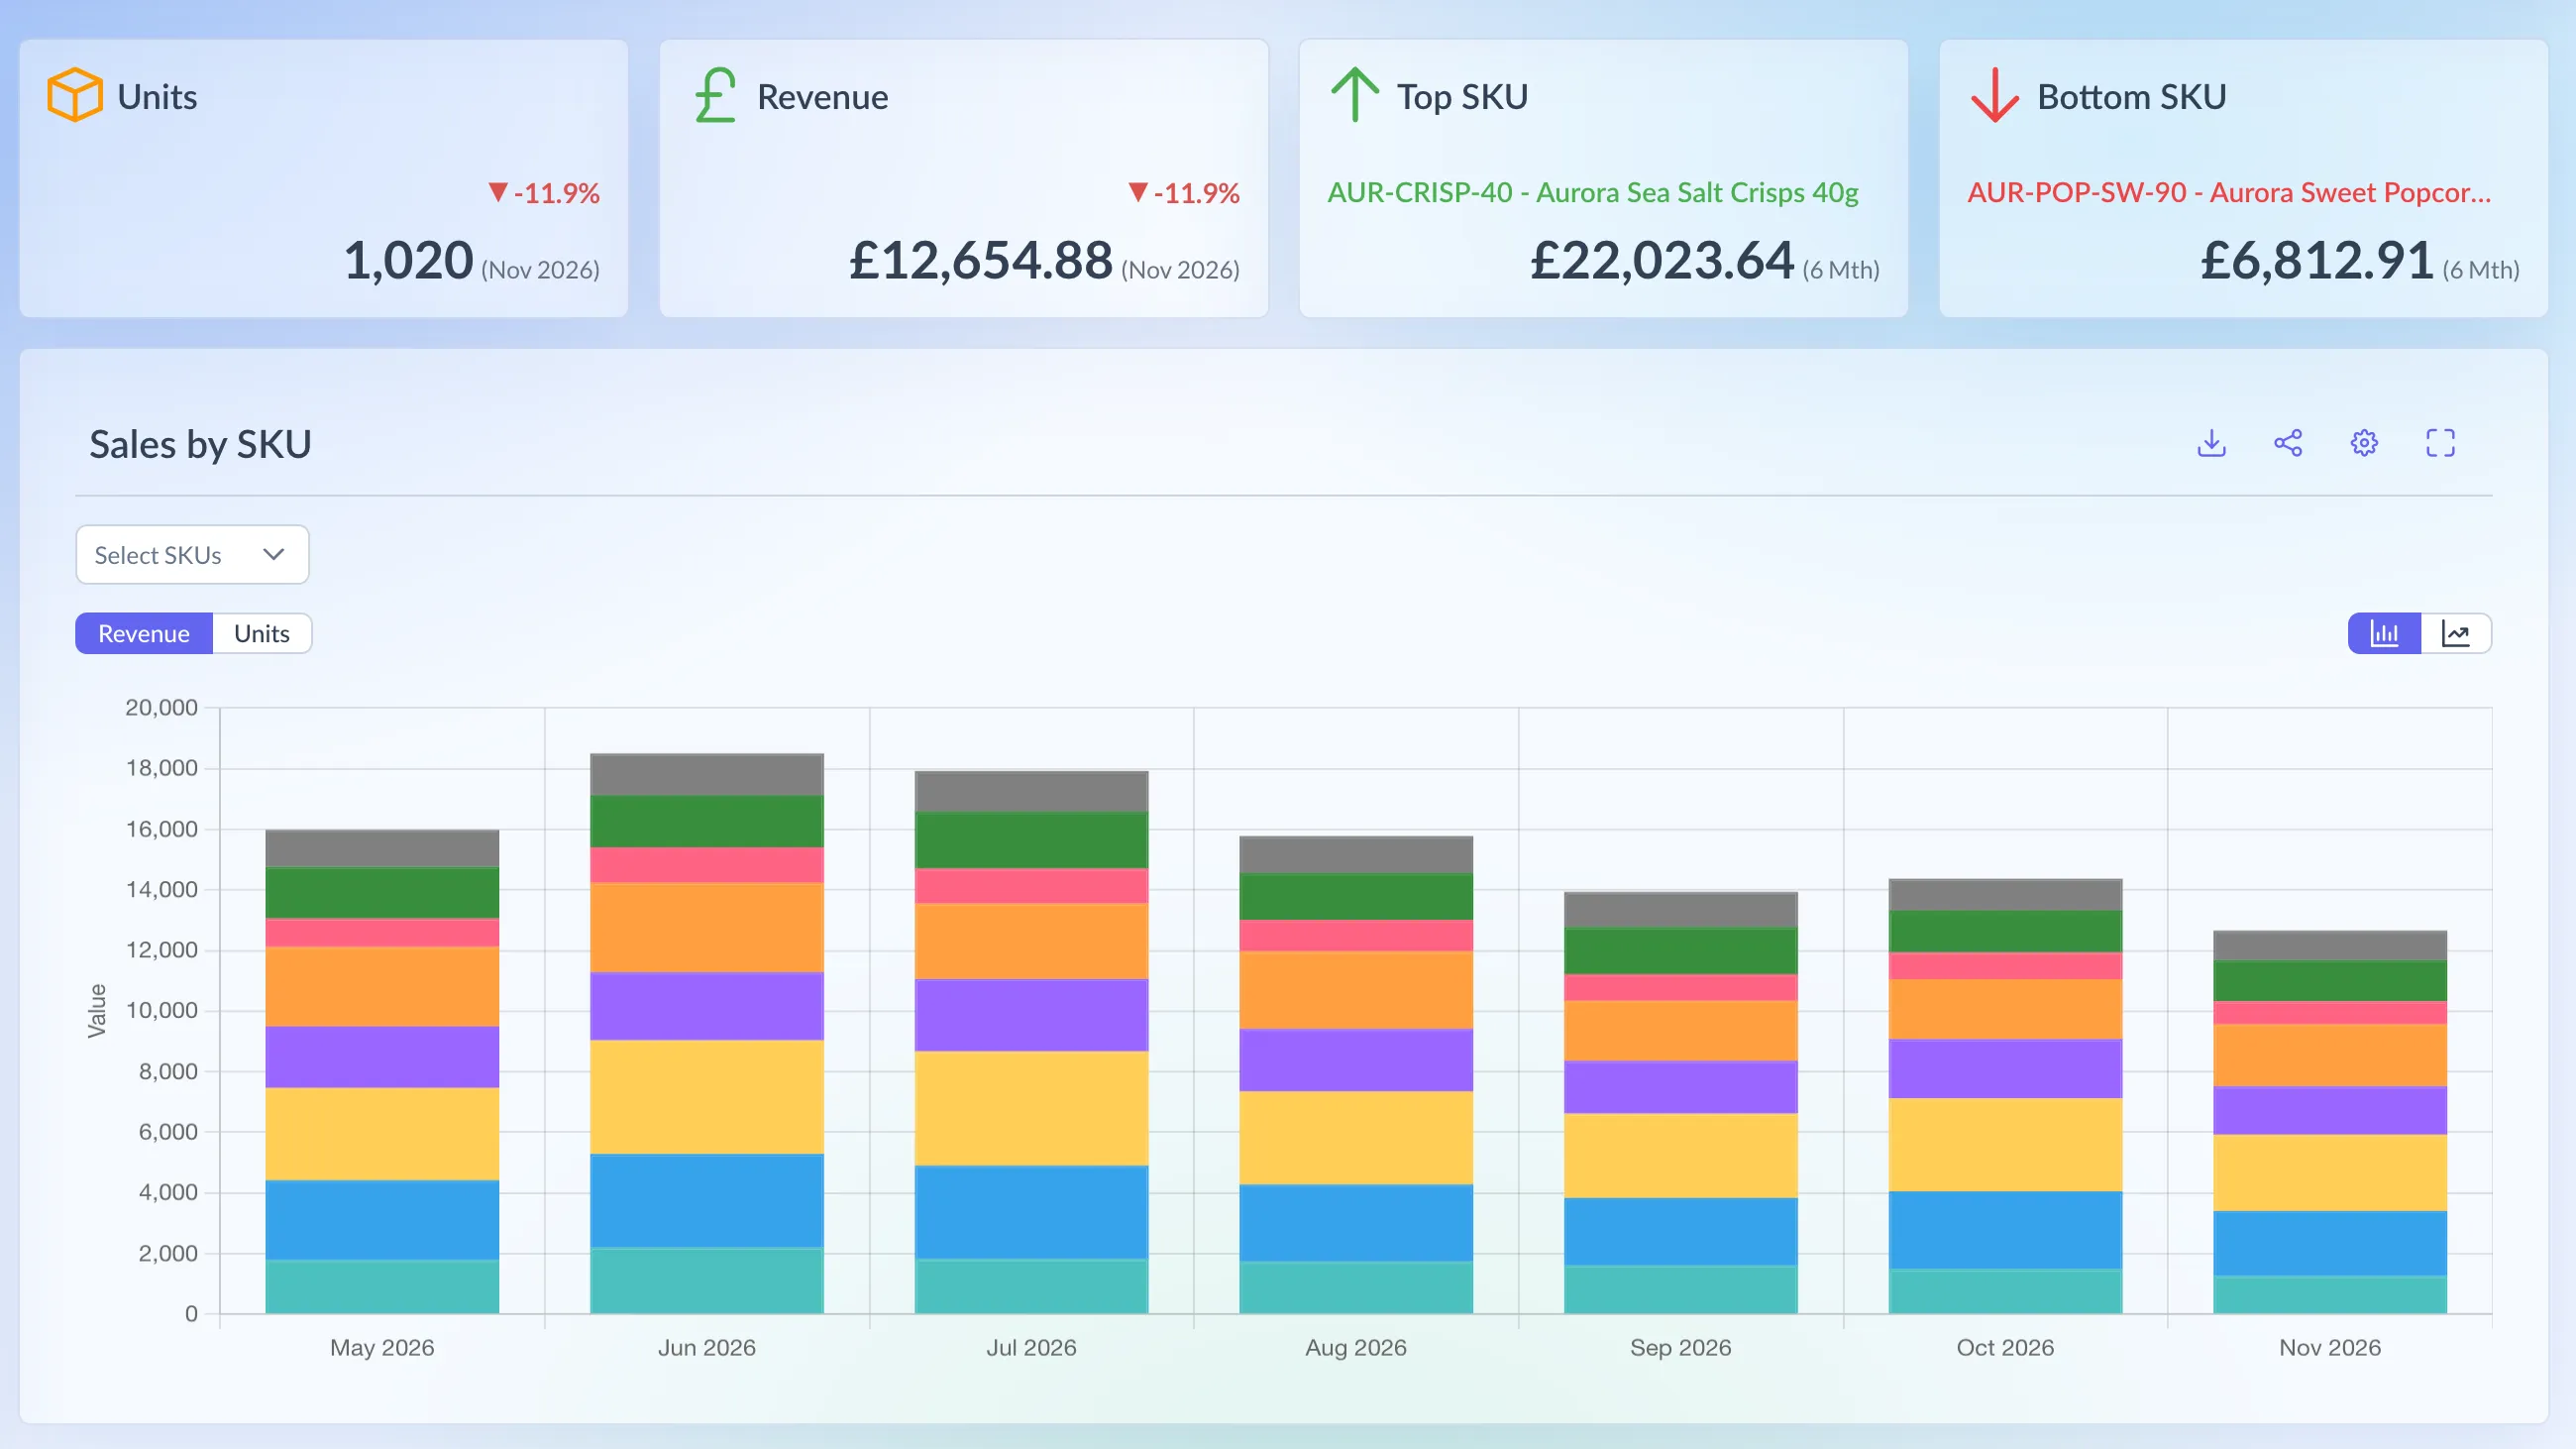
Shown on demo data.
Under All Retailers there are two more:
- Sales (titled Total Sales on the page): one series per retailer, stacked as bars, with Units, Revenue, Top Retailer and Bottom Retailer cards.
- Yearly Sales: one line per year, by week number or by month, so you can lay this year over last.
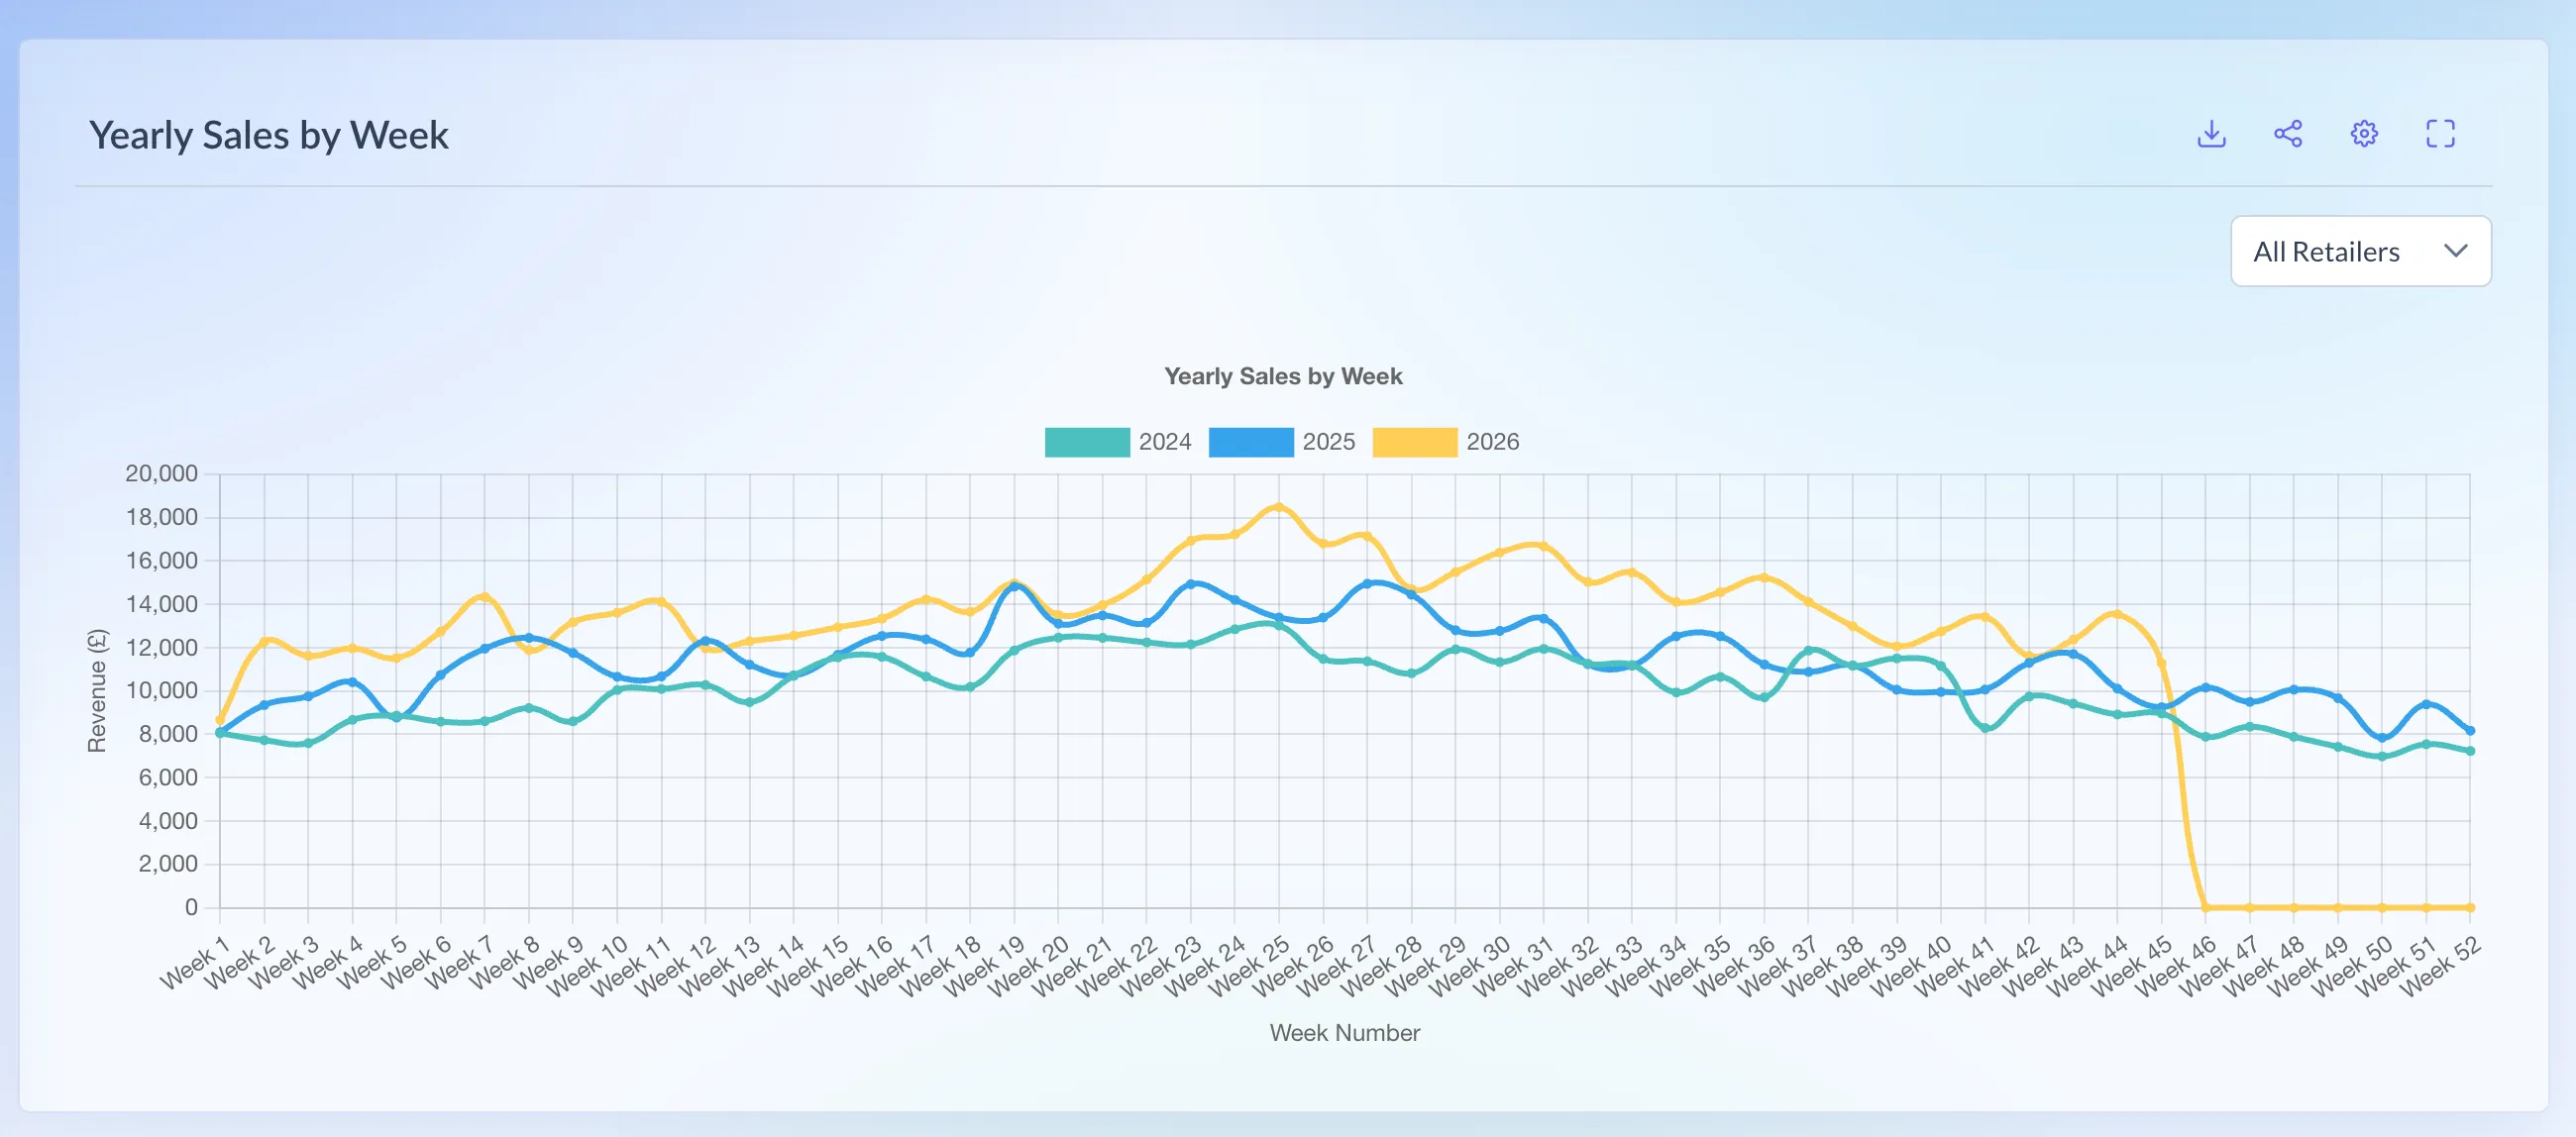
Shown on demo data.
How it’s worked out
Section titled “How it’s worked out”- Each figure is your sales added up for the period. Weeks run Monday to Sunday and are labelled with the Monday, such as “05 Oct 2026”. Months are calendar months, such as “Oct 2026”.
- The cards’ change is worked out like this, to 1 decimal place (2 on All Retailers):
Change = (latest period minus the period before) ÷ the period before × 100
- Yearly Sales by week uses ISO week numbers: week 1 is the week with the year’s first Thursday, so a week starting in late December can be week 1 of the next year.
Which retailers have it
Section titled “Which retailers have it”The three retailer pages are on Asda, Booths, CLF, Holland & Barrett, Morrisons, Sainsbury’s, Tesco, Tesco ROI and Waitrose.
- Ocado has Sales only, because it reports by brand, not by SKU. Its weeks run Monday to Sunday, its £ includes VAT, and a month is the weeks that start in it.
- CLF is a wholesaler. Its figures are what CLF despatched to its customers, with revenue worked out as units × CLF’s trade price.
Using the page
Section titled “Using the page”- In the menu, open a retailer and choose Sales or a Sales by SKU item, or open All Retailers.
- Choose Revenue or Units, and a bar or line chart. Yearly Sales is revenue only, as lines.
- On Sales by SKU, use Select SKUs to pick some SKUs, or leave it for all of them. On the pie, the Only show top slider sets how many SKUs get their own slice, once you have 10 or more.
- Click the cog (Settings) for the Time frame (Monthly or Weekly) and Date range (All, 6 Months, 12 Months or Custom). The defaults are Monthly and 6 Months, except the pie, which starts on Weekly.
- Yearly Sales always shows all your history, and its settings have only Time frame (default Weekly). Pick All Retailers or one retailer from the dropdown.
- Save keeps your settings and Reset restores the defaults. A saved setting applies to that page at every retailer, so saving Weekly on Tesco Sales makes every Sales page weekly. Sales by SKU also remembers your SKUs.
Full View adds a table under the chart, and Download gives you a CSV.
Reading the numbers
Section titled “Reading the numbers”- 6 Months by month shows seven bars: it starts on the 1st of the month six months back.
- Waitrose weeks run Sunday to Saturday and are shown against the Monday, so a single Waitrose week is a day out of line with other retailers.
- Morrisons units include wholesale, which comes with no sales value, so it adds to units but not to revenue.
- Mixing retailers: Holland & Barrett revenue is ex VAT and Ocado’s includes VAT, and All Retailers adds them as sent.
- Yearly Sales: this year’s line drops to 0 after the latest week, and a year sits at 0 before your history starts.