

Sales Overview
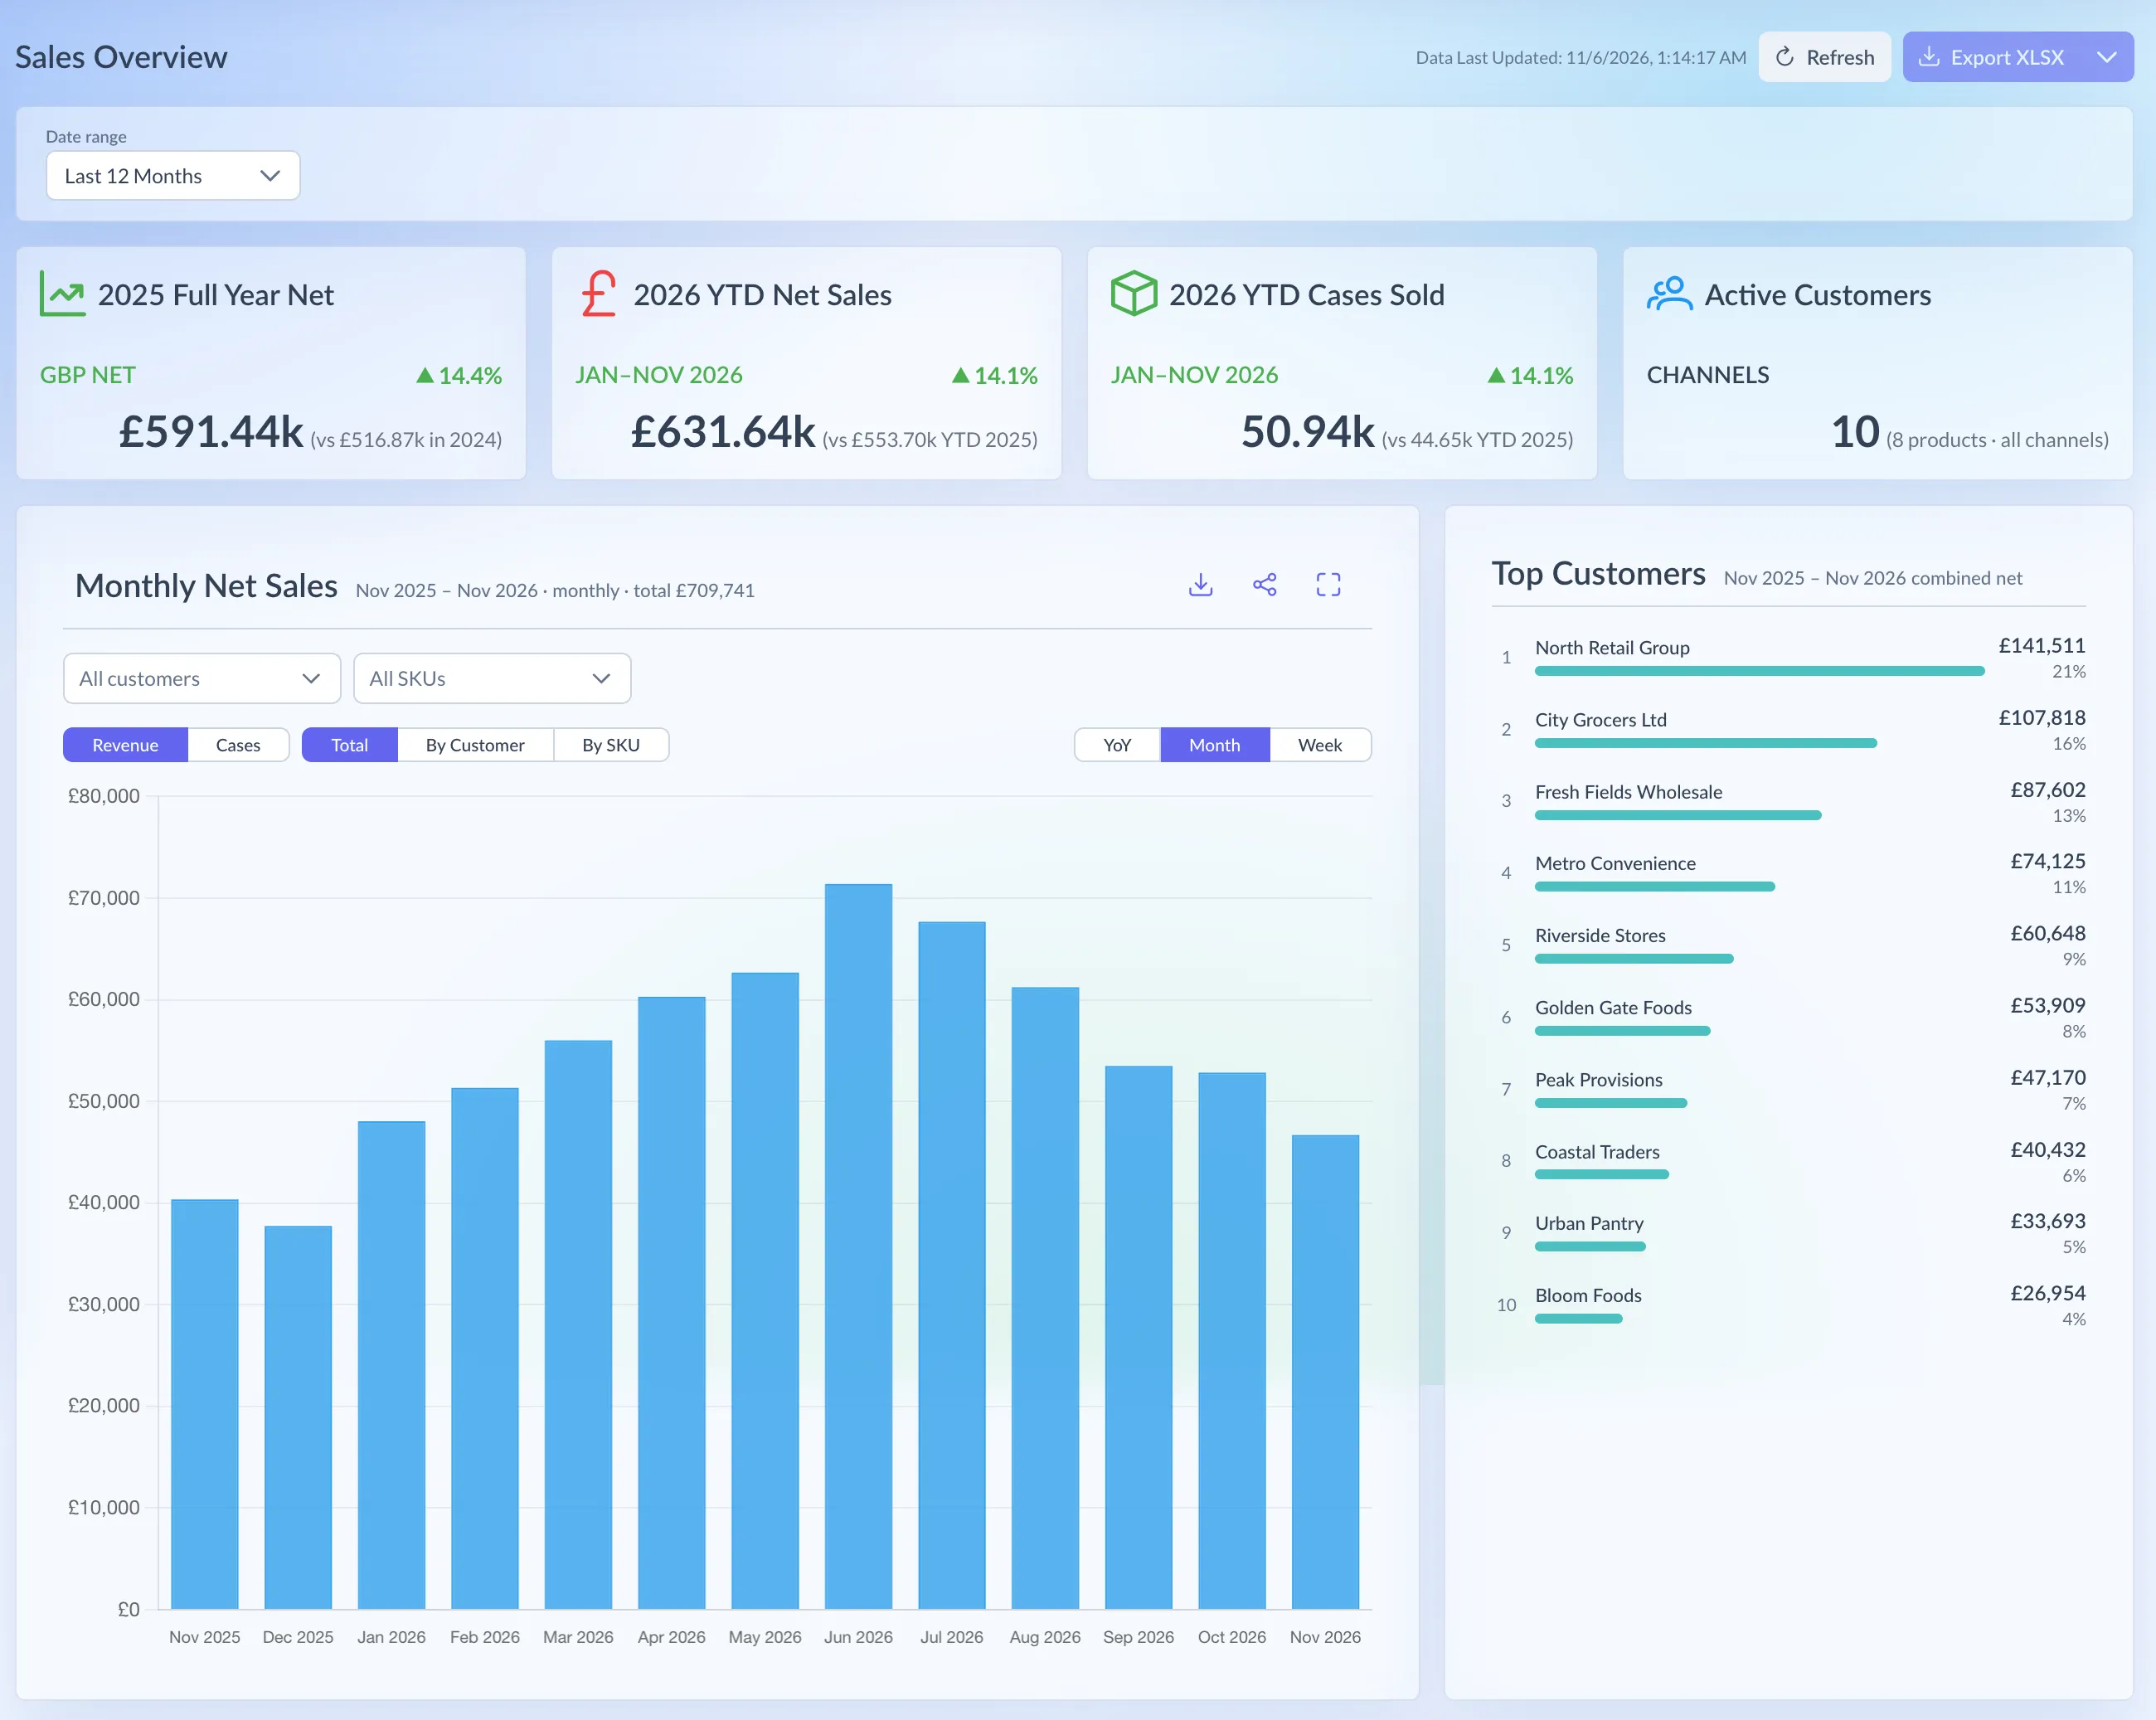
Sales Overview is the first page you see in WFL Sales. It shows what WFL has invoiced for your brand: this year against last, net sales over time, and your biggest customers and products.
Shown on demo data.
What it shows
Section titled “What it shows”- The cards at the top: last year’s full-year net sales, this year’s net sales to date, cases sold this year to date, and Active Customers.
- Monthly Net Sales, a bar chart (Weekly Net Sales in the Week view).
- Top Customers, the ten customers with the most net sales in your date range.
- Product Performance, your top eight products, and Product Mix, the top six as a share of net sales.
- Annual Net Sales History and Q1 Month-on-Month, lower down. They use fixed calendar periods, so the date range doesn’t change them.
Every figure is net, before VAT, in one currency at a time.
Using the page
Section titled “Using the page”- Click WFL Sales at the top of Pivot, or choose Overview under Sales in the menu.
- Pick a Date range: All, Year to Date, Month to Date, Last Month, Last 6 Months, Last 12 Months (the default) or Custom Range.
- If WFL invoices your brand in more than one currency, pick one with Currency. The page opens on pounds when there are any.
- On the chart, choose Revenue or Cases, and YoY, Month or Week. In Month and Week you can stack each bar By Customer or By SKU instead of showing the Total.
- To focus the chart, pick from All customers and All SKUs.
Pivot remembers your date range and chart choices for next time. The currency goes back to pounds on each visit.
Reading the numbers
Section titled “Reading the numbers”- The cards compare like for like. The year-to-date cards set this year against the same days last year.
- Active Customers counts every customer with sales in the chosen currency, at any time. The line underneath counts the products sold in your date range.
- The chart rounds to whole months or weeks. Last 12 Months shows 13 monthly bars, and the latest fills in as WFL uploads. The lists use your exact dates, so their totals won’t quite match.
- Weeks run Saturday to Friday by invoice date, labelled with the Friday.
- YoY puts last year and this year side by side for each month, with the change as a line. It always covers 1 January last year to today, and so do the product lists while it’s on. Top Customers shows each customer’s change this year to date, ranked by Biggest Movers or By Size.
- Top Customers’ shares are of the ten shown, so they add up to 100%. They aren’t a share of all your sales.
- One customer is one WFL account, shown under the name used most on its invoices.
Downloading
Section titled “Downloading”Export XLSX, at the top, downloads the invoice lines behind the page, in your currency and date range and for any customers or SKUs picked on the chart. For every line in every currency, choose All Data from its menu. The chart’s own Download gives a CSV of the bars.