

Tesco Order Dashboard
The Order Dashboard follows one product through Tesco’s supply chain: what Tesco forecast, what it ordered, how it changed the order and what was delivered. It shows the same figures as the Product Dashboard in Tesco Connect’s Supplier Ordering, but Pivot keeps a copy each day, so you can step back and see how the forecast and orders moved.
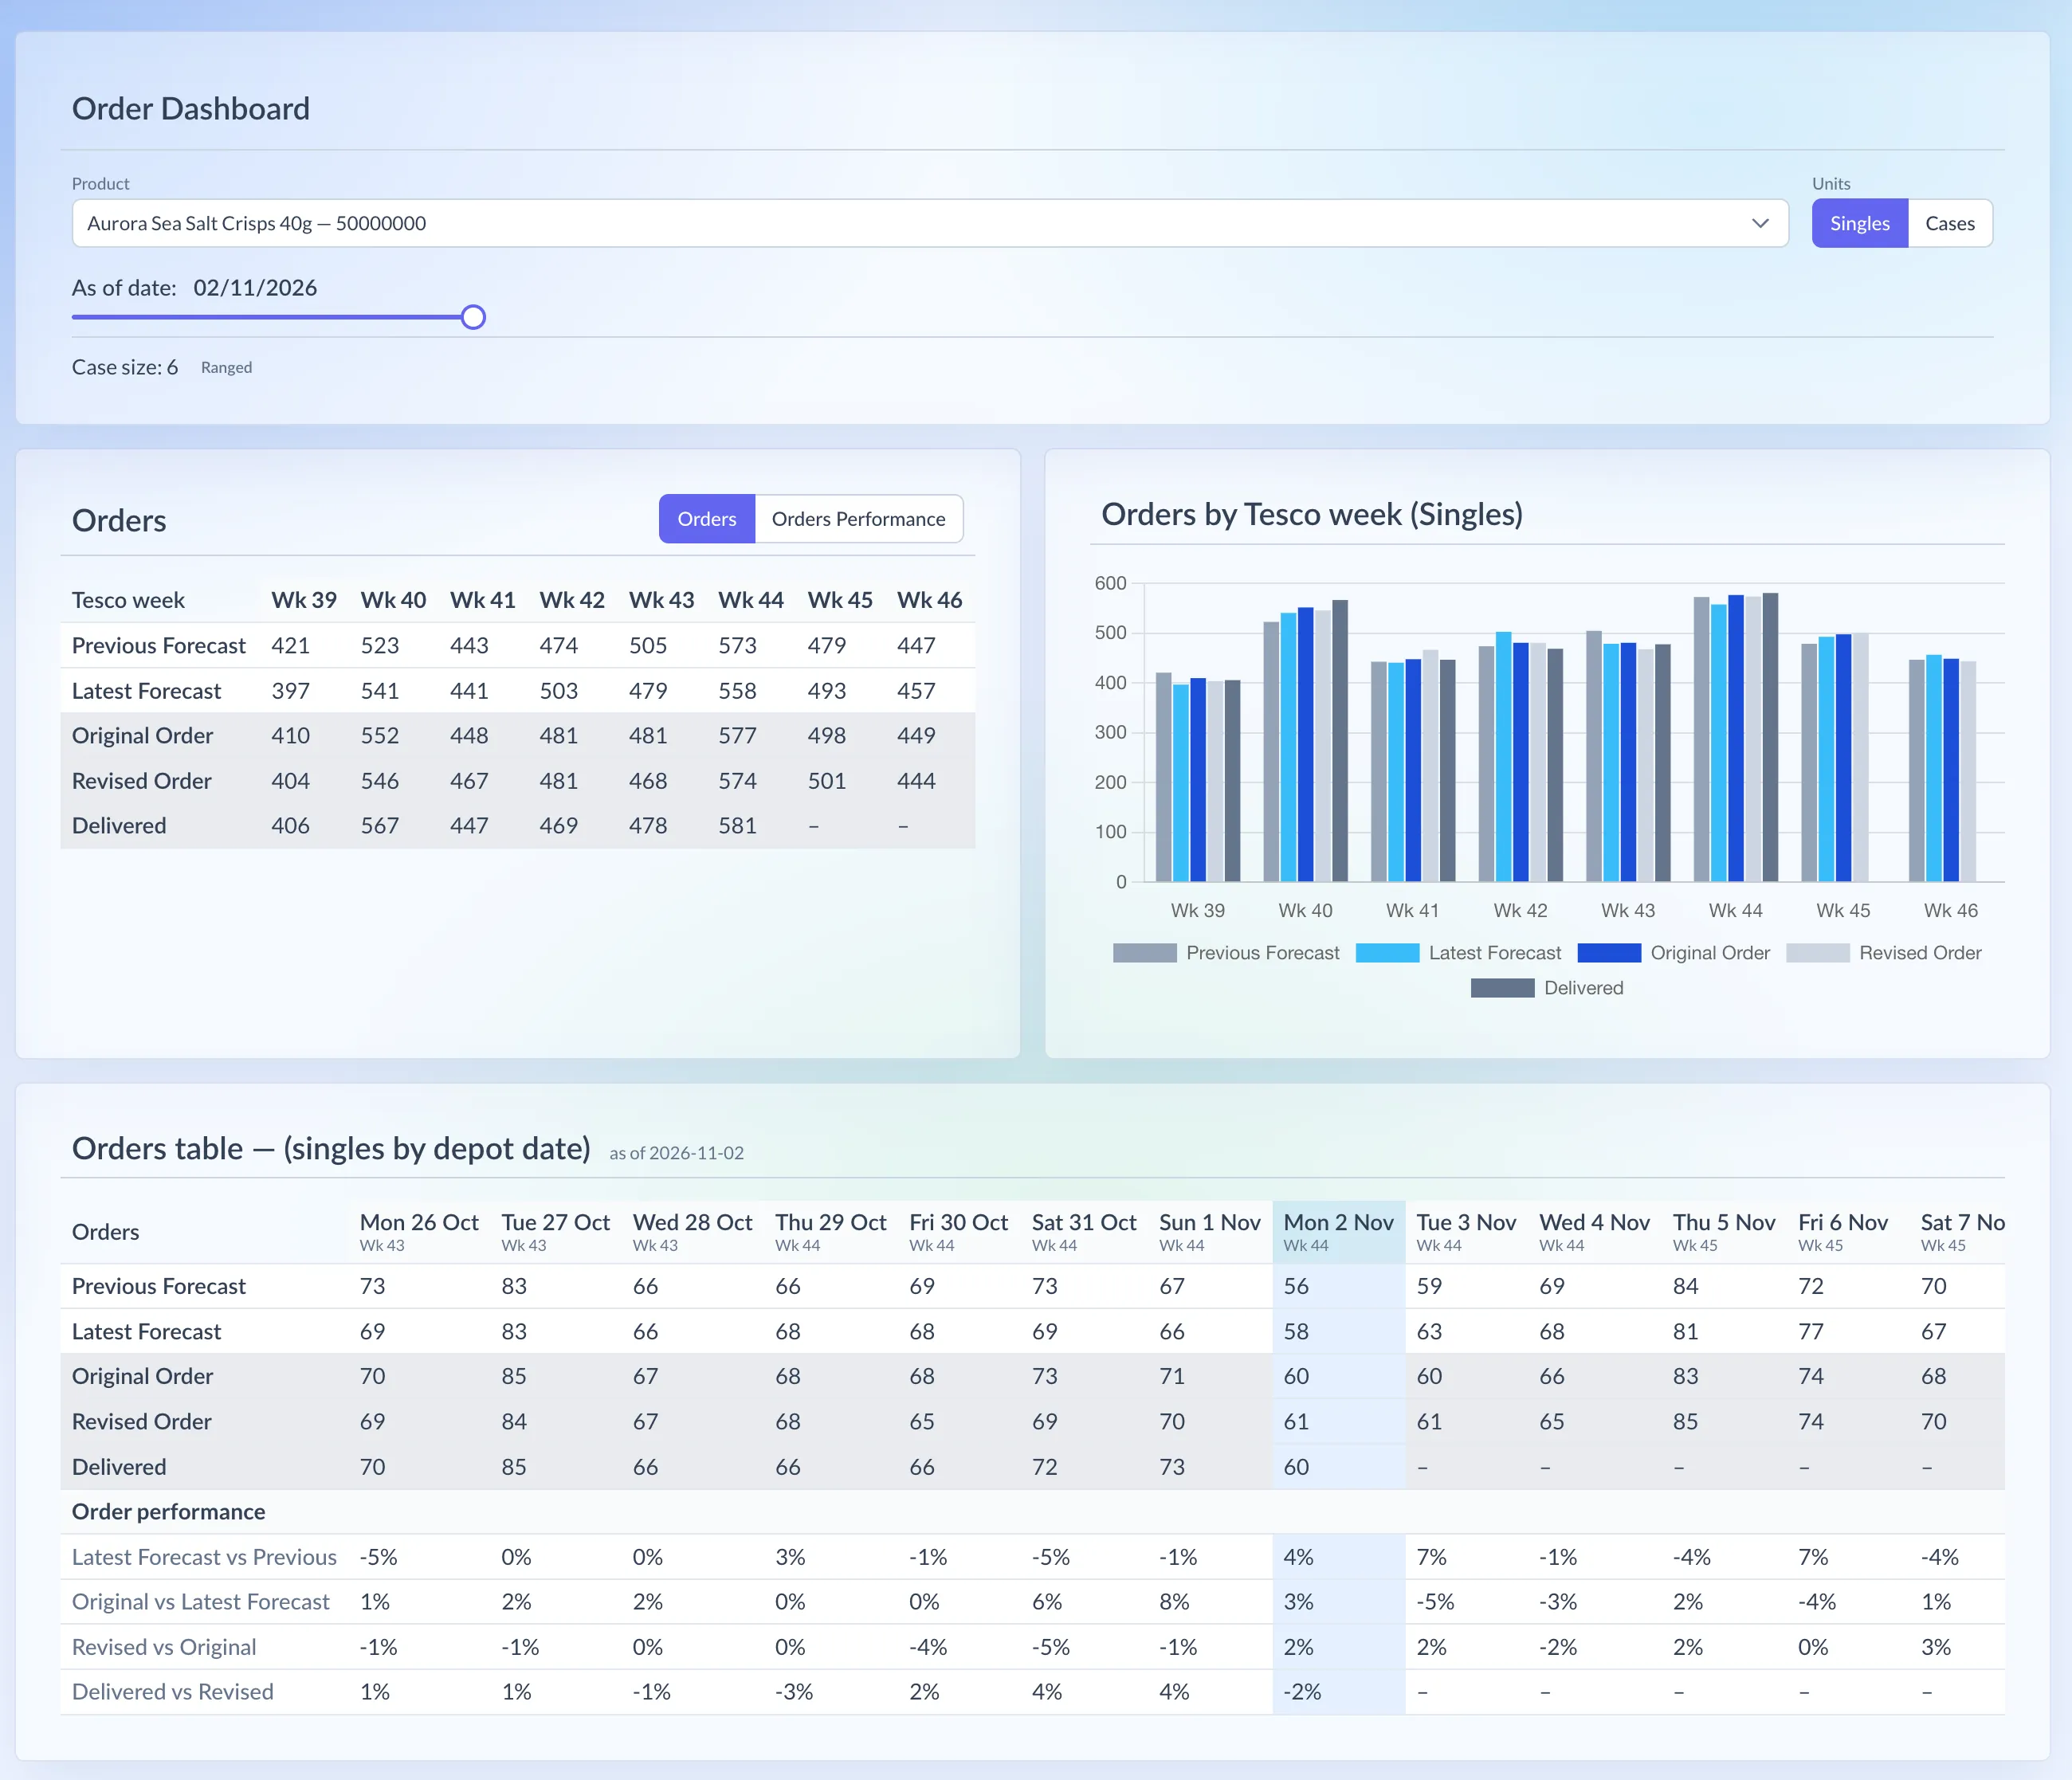
Shown on demo data.
What it shows
Section titled “What it shows”Five figures, with Tesco’s own names:
- Previous Forecast: Tesco’s forecast before its latest run.
- Latest Forecast: Tesco’s current forecast.
- Original Order: the order as Tesco first raised it.
- Revised Order: the order after Tesco’s changes.
- Delivered: what was delivered against it.
They’re shown by Tesco week and by depot date (the day stock is due at Tesco’s depots).
How it’s worked out
Section titled “How it’s worked out”The Orders Performance figures compare each step with the one before:
- Latest Forecast vs Previous
- Original vs Latest Forecast
- Revised vs Original
- Delivered vs Revised
Change = (first figure ÷ second figure) - 1, as a whole %
So “Delivered vs Revised” of -2% means 2% less was delivered than the revised order asked for. A cell shows a dash when either figure is missing.
Which retailers have it
Section titled “Which retailers have it”- Tesco
It’s built from Tesco’s own supplier ordering data, so no other retailer has it. Tesco ROI isn’t included. For the other side of Tesco’s supply, see Service Level.
Using the page
Section titled “Using the page”- In the menu, open Tesco and choose Order Dashboard.
- Choose a Product. Type part of the description or the TPNB to find it. The list holds your products in Tesco’s data.
- Choose Units: Singles (the default) or Cases. Cases divides by the product’s case size and rounds to whole cases. The case size and the product’s range status show under the filters.
- Drag the As of date slider to see the dashboard as it stood on an earlier day. It starts on the latest. Pivot keeps 30 days, and Tesco doesn’t serve older ones, so they can’t be recovered.
- In the Orders panel, switch between Orders and Orders Performance to see the weekly figures or the weekly percentages.
Reading the numbers
Section titled “Reading the numbers”- Orders by Tesco week charts the five figures side by side for each week.
- The Orders table below has a column per depot date, with the Tesco week under each date. Every day between the first and last date with data is shown. The as of date is highlighted, so days to its left are past and days to its right are still to come.
- Order performance rows under the daily figures give the same four percentages for each day.
- Delivered is blank for dates still to come.